|
Developing the Workforce for Tomorrow Eight years of economic growth has done us a world of good. Minnesota's overall unemployment rate is relatively low. Now, despite a recent economic downturn, we predict an ongoing workforce shortage, which will make us less competitive in a global marketplace. It's vital to our ongoing economic health that we have a well-trained, flexible and healthy workforce that allows us to be quickly responsive to the opportunities that globalization presents. That means training and retraining constantly during a person's working life. It means looking after displaced workers to get them back into the game with salable skills. It means providing adequate medical care and benefits to injured workers, so that they can return to suitable work as soon as possible. It means finding new workers. When someone says, "We need good people who can do X, Y and Z. Do you have them for us?" We want to be able to say, "You bet we do!"
The Big Accounting Initiative Score Average weekly wage of Minnesotans. Percentage of workers earning less than $10 per hour. Ranking among states in labor force participation for all adults, men, women and youth. Employment three months after completing a public workforce development program. Hourly wages three months after completing a public workforce development program. |
|||||||||||||||||||

|
|||||||||||||||||||
|
|
|
||||||||||||||||||
|
Source: Average wages include all Covered Employment and Wages (ES-202), Research and Statistics Office, Minnesota Department of Economic Security. Note: The average wage of Minnesotans is directly related to the health of our economy, the quality of jobs available, and the capacities of our workers. The state affects this objective by creating a tax and business climate that attracts business, assisting the development of industries that offer higher paying jobs, and by educating and training our workforce. With the state economy slipping into recession, growth in the average weekly wage slowed in 2001. |
|||||||||||||||||||
| top
|
|||||||||||||||||||
|
Source: Based on analysis of administrative records collected by the Minnesota Department of Economic Security. Analysis conducted by the Research and Statistics Office, Minnesota Department of Economic Security |
|
||||||||||||||||||
Note: The proportion of high to low paying jobs is related to the quality of jobs available, and the capacities of our workers. The state affects this objective by assisting the development of industries that offer higher paying jobs, and by educating and training our workforce. |
|||||||||||||||||||
| top
|
|||||||||||||||||||
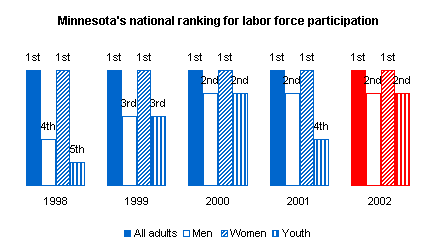
Ranking among states in labor force participation for all adults, men, women and youth. |
|||||||||||||||||||
|
Source: Geographic Profile of Employment and Unemployment, Bureau of Labor Statistics, U.S. Department of Labor. |
|||||||||||||||||||
Note: Labor force participation rates measure the percentage of the population (over-16 and living in the community) who are working or looking for work. This indicator reflects the level of economic opportunity available in the state and how well the economy is utilizing its pool of potential workers. Higher labor force participation rates show that the skills of the workforce fit well with the available jobs, and that those jobs can be held by a wide variety of workers, including those who are traditionally underrepresented in the workforce, such as people with disabilities or older workers. Minnesota's economy, employers, workers and workforce programs have consistently put the state among the nation's leaders in labor force participation. In 2000, 75.1% of Minnesota's adults (over-16 and living in the community) were working or looking for work. This includes 80.1% of men, 70.3% of women, and 69.8% of youths aged 16-19. |
|||||||||||||||||||
| top
|
|||||||||||||||||||
Employment three months after completing a public workforce development program. |
|||||||||||||||||||
|
|
|
||||||||||||||||||
Note: This and the following two indicators work in tandem - looking at placement alone might encourage pushing any job, whether or not it leads to economic self-sufficiency. Measuring wages alone might result in a high average hourly wage but a low placement rate. These indicators reflect the success of those public workforce programs for which the relevant data was available, and for which employment is the desired outcome of the program. |
|||||||||||||||||||
| top
|
|||||||||||||||||||
Hourly wages three months after completing a public workforce development program. |
|||||||||||||||||||
|
|
|
||||||||||||||||||
Note: This indicator reflects the success of public workforce programs for which relevant data was available, and for which employment is the desired outcome of the program. Performance in 2001 did not meet our target and slipped from 2000 performance. In the current economic environment, our customers find fewer opportunities for placement, much less placement at higher wages. |
|||||||||||||||||||
| top
|
|||||||||||||||||||


