|
Trade: Tapping the World's Interest in Minnesota Products, services and ideas don't sell themselves, and the global marketplace is increasingly a noisy, busy, hurry-up kind of place. If we want to stand out in the fray, we must make vigorous efforts to showcase what Minnesota has to offer. With more than $17 billion in foreign sales of our manufactured goods, services and agricultural products, Minnesota is already an international player. At this time, however, the eyes of the world are upon Minnesota in a way they have never been before. A singular opportunity exists to convert the world's interest in the state of Minnesota and this Governor into increasing trading and business opportunities for Minnesota companies.
|
|||||||||||||||||||||||||||
The Big Accounting Initiative
Score Goal: Improve competitiveness and exports of Minnesota products. Total value of Minnesota's manufactured and agricultural exports. Minnesota's share of U.S. manufactured exports. Minnesota and U.S. export growth rates Goal: Expand Minnesota business presence in global marketplace. |
|||||||||||||||||||||||||||

|
|||||||||||||||||||||||||||
Total value of Minnesota's manufactured and agricultural exports. |
|||||||||||||||||||||||||||
|
|
|
||||||||||||||||||||||||||
Source: U.S. Department of Commerce and University of Massachusetts, Amherst; Massachusetts Institute for Social and Economic Research (MISER). U.S. Department of Agriculture, Economic Research Service. Note: Increasing the amount of Minnesota goods exported expands the state's role in the global economy. It also expands the markets available to Minnesota's companies, offering their employees and communities opportunities to grow and profit. Manufactured exports have increased almost every year since 1990. Agricultural exports have been cyclical with peaks in 1990, 1992 and 1996 and valleys in 1991, 1994 and 1999. Exports are goods and services that are produced in the United States and sold in another country. The value of Minnesota's manufactured exports represents products that began their export journey in Minnesota. The actual port of departure may not be Minnesota (for example, products shipped from Minnesota to O'Hare). |
|||||||||||||||||||||||||||
Learn more at http://www.dted.state.mn.us/big-pl-prog-rpt-f.asp or http://www.dted.state.mn.us |
top
|
||||||||||||||||||||||||||
|
|
|
||||||||||||||||||||||||||
Source: U.S. Department of Commerce and University of Massachusetts, Amherst; Massachusetts Institute for Social and Economic Research (MISER). Note: Increased exports may only indicate an overall increase in trade. An increase in Minnesota's share of U.S. manufactured exports could indicate an increase in Minnesota's global competitiveness. Minnesota's share of U.S. manufactured exports fell during the 1990s. The state's two largest manufactured export industries are industrial machinery (which includes certain computer-related equipment) and scientific instruments manufacturing (which includes medical devices). Minnesota's share of U.S. manufactured exports is the value of Minnesota's manufactured exports divided by the value of U.S. manufactured exports. The value of Minnesota's manufactured exports represents those manufactured products that began their export journey in Minnesota. The actual port of departure may not be Minnesota (for example, products shipped from Minnesota to O'Hare.) |
|||||||||||||||||||||||||||
Learn more at http://www.dted.state.mn.us/big-pl-prog-rpt-f.asp or http://www.dted.state.mn.us |
top
|
||||||||||||||||||||||||||
|
|
|||||||||||||||||||||||||||
|
Source: U.S. Department of Commerce and University of Massachusetts, Amherst; Massachusetts Institute for Social and Economic Research (MISER). Note: Export growth indicates a dynamic increase in Minnesota's involvement in the global economic system. Increasing growth compounds Minnesota's interconnection with other economies. |
|||||||||||||||||||||||||||
Learn more at or http://www.dted.state.mn.us/big-pl-prog-rpt-f.asphttp://www.dted.state.mn.us |
top
|
||||||||||||||||||||||||||
|
|
|
||||||||||||||||||||||||||
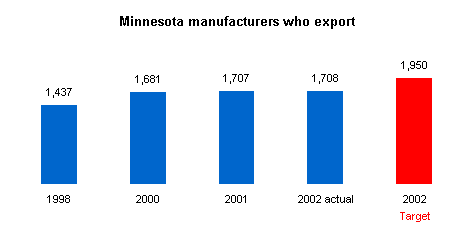
Source: Harris InfoSource. Note: The estimate of Minnesota manufacturers who export increased rapidly during the late 1990s. However, recent poor worldwide economic conditions have made it difficult for Minnesota manufacturers to enter export markets for the first time. This performance should improve once demand improves in key markets. |
|||||||||||||||||||||||||||
Learn more at http://www.dted.state.mn.us/big-pl-prog-rpt-f.asp or http://www.dted.state.mn.us |
top
|
||||||||||||||||||||||||||
|
|
|
||||||||||||||||||||||||||
Note: Indicator under development. |
|||||||||||||||||||||||||||
|
top
|
||||||||||||||||||||||||||


