|
Jesse "the Tourism Governor" Ventura: Tourism is about having fun, but it's also about the bottom line. Because every dollar invested results in dollars in return, Minnesota's tourism industry deserves our support and leveraging. People are paying attention to Minnesota. We should capitalize on their curiosity, welcome them with open arms and show them just why Minnesota is worth visiting and investing in. Minnesota is truly unique in the Upper Midwest, with a wealth of recreational and cultural attractions. Governor Ventura delivers a monthly Minnesota tourism message on why the world should come to Minnesota.
|
|||||||||||||||||||||||||
The Big Accounting Initiative
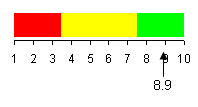
Score Goal: Increase tourism activity in the state. Sales generated by Minnesota's tourism industry. Number of international overseas visitors to Minnesota. Number of domestic (U.S.) visitors to Minnesota | |||||||||||||||||||||||||

|
|||||||||||||||||||||||||
|
|
|
||||||||||||||||||||||||
|
Source: Minnesota Department of Trade and Economic Development. Note: Minnesota's tourism-generated sales increased 19 percent between 1995 and 1999. The chart represents sales within the tourism industry and those industries supported by tourism, such as Minnesota suppliers. The Department of Trade and Economic Development analyzes several data sets and uses statistical tools and computer programs to estimate these sales. Tourism is increasingly considered a tool for economic diversification. Many regions are promoting tourism to provide economic activity and bring new money into their areas, especially from outside the state. |
|||||||||||||||||||||||||
Learn more at http://www.dted.state.mn.us/big-pl-prog-rpt-f.asp or http://www.dted.state.mn.us |
top
|
||||||||||||||||||||||||
|
|
|
||||||||||||||||||||||||
|
*For the four quarters ending with the first quarter of 1999. Note: International visitors to Minnesota tend to stay longer and spend more money than domestic visitors. As a result, they are highly desirable tourists. An increase in international visitors is generally considered beneficial for the tourism industry. The estimated number of international overseas visitors to Minnesota increased significantly between 1994 and 1999. Two different data sources, from the Metropolitan Airports Commission and the U.S. Department of Transportation, were used to create estimates of international travelers. The data was adjusted to avoid counting returning Minnesotans and immigrants. The number used is the midpoint between the two sources. |
|||||||||||||||||||||||||
Learn more at http://www.dted.state.mn.us/big-pl-prog-rpt-f.asp or http://www.dted.state.mn.us |
top
|
||||||||||||||||||||||||
|
|
|
||||||||||||||||||||||||
Data note: Due to changes in survey methodology, data from 1994-1998 are not directly comparable with later data. This chart uses a three-year moving average which may reduce the data variability due to potential sample errors. Source: Travel Industry Association, Travelscope surveys. Note: Bringing people to Minnesota for travel and tourism brings money to the state. Tourism is an important industry in the state. Bringing more travelers to the state improves the industry and Minnesota's economy overall. |
|||||||||||||||||||||||||
Learn more at http://www.dted.state.mn.us/big-pl-prog-rpt-f.asp or http://www.dted.state.mn.us |
top
|
||||||||||||||||||||||||
|
|
|
||||||||||||||||||||||||
Source: Travel Industry Association, Travelscope surveys. Note: While non-residents are important to Minnesota's tourism industry, it is also important to keep the states residents vacationing here. According to the survey estimates, trips taken by residents increased between 1999 and 2000.
|
|||||||||||||||||||||||||
Learn more at http://www.dted.state.mn.us/big-pl-prog-rpt-f.asp or http://www.dted.state.mn.us |
top
|
||||||||||||||||||||||||
|
|
|
||||||||||||||||||||||||
|
Source: Surveys of MOT customers conducted by the Analysis and Evaluation Office, Minnesota Department of Trade and Economic Development. Influenced sales (expenditures) are derived through surveys administered by the departmentís Analysis and Evaluation Office in partnership with MOT. This data represents travel expenditures by MOT inquirers who reported through a survey that the printed information they received influenced their decision to take a pleasure trip to Minnesota. Note: Minnesotans expect a return on the investment of government funds. The Minnesota Office of Tourism publishes a variety of materials to promote Minnesota tourism, and tracks their effect on traveler's decisions. This is an important way to see a concrete outcome from government programs. |
|||||||||||||||||||||||||
Learn more at http://www.dted.state.mn.us/big-pl-prog-rpt-f.asp or http://www.dted.state.mn.us |
top
|
||||||||||||||||||||||||


