|
State Departments: Best Bang for the Buck The state must reaffirm its commitment to quality service for its citizens - with success measured by actual outcomes rather than process - and to a cost-conscious state government. Increasing the efficiency of government, continuously increasing the quality of services, and obtaining the best value for every taxpayer dollar spent is a hallmark of the Ventura-Schunk administration. Governing Magazine, in cooperation with the Government Performance Project at Syracuse University, has developed a comprehensive set of key indicators for the management of state government to periodically assess all 50 states. Minnesota has decided to use these indicators to shape our own management goals and strategies.
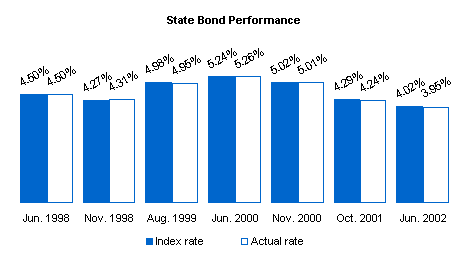
The Big Accounting Initiative Score Goal: Improve overall Governing Magazine grade, and improve key Governing Magazine indicators of a well-managed state, in the areas of financial and capital management, information technology, human resources and results management. Overall Governing Magazine grade. Highest possible bond rating (financial management).
Debt service as a percentage of revenues (capital management). Capital repair appropriations, as compared with total building value (capital management) Number of financial government services that can be transacted online (information technology). Time to fill state worker employment vacancies (human resources). |
|||||||||||||||||||||

|
|||||||||||||||||||||
|
|
|||||||||||||||||||||
Note: In cooperation with the Government Performance Project at Syracuse University, Governing Magazine publishes a biannual review of how well states are managed. Minnesota is making special efforts to apply the criteria for excellence set by the Government Performance Project. While actually managing well is more important than any grade the state might receive, we believe that many of these criteria provide good indicators of success at getting the "best bang for the buck." Graded on a curve with all 50 other states, Minnesota received an overall grade of B in its management for 1998 and in 2000. Target: Governing Magazine overall grade to at least an A minus, if not an A. |
|||||||||||||||||||||
| top
|
|||||||||||||||||||||
 |
|||||||||||||||||||||
|
|
|||||||||||||||||||||
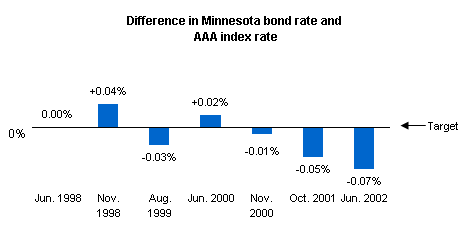
Note: The state's AAA bond rating is the highest rating available, a signal to investors that state bonds are of the highest quality and, therefore, carry the least amount of risk. The index rate is based upon AAA interest rates on the day of each bond sale. Selling state bonds at the index rate is a confirmation that investors agree with the rating. |
|||||||||||||||||||||
| top
|
|||||||||||||||||||||
Debt service as a percentage of revenues (capital management). |
|||||||||||||||||||||
|
|
|
||||||||||||||||||||
Note: Debt service is the principal and interest payments paid on bonds issued by the state. Revenue includes all receipts to the general fund that are not dedicated for a particular use. Each biennium, Minnesota appropriates for debt service an amount that is no more than 3 percent of general fund revenues. This guideline provides a constraint on the size of future capital budgets - keeping state borrowing in proportion to state income. Capital budgets are mainly funded from the proceeds of state general obligation bonds. Constraining the amount of debt service available results in a limit on the amount of new bonds that can be issued. |
|||||||||||||||||||||
| top
|
|||||||||||||||||||||
Capital repair appropriations, as compared with total building value (capital management) |
|||||||||||||||||||||
|
|
|||||||||||||||||||||
|
|||||||||||||||||||||
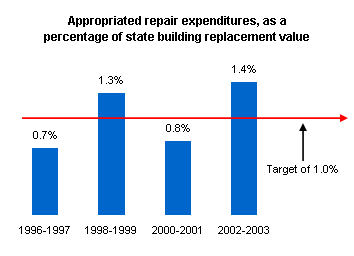
Note: Repairing and maintaining current facilities and state infrastructure is as important as new construction. Current assets and facilities must be repaired so they can continue to provide value to the public. The Department of Administration estimates the state's deferred maintenance backlog to be in excess of $1.5 billion. Operating budgets cannot fill this void, so aggressive funding levels must be provided in the bonding bills to upgrade state facilities and protect our public investment. The administration believes that repair appropriation's equal to at least 1% of the total building replacement value must be provided. Funding should come from both capital and operating budgets. This indicator measures the Governor's proposals compared to what actually gets passed and signed. |
|||||||||||||||||||||
| top
|
|||||||||||||||||||||
Number of financial government services that can be transacted online (information technology). |
|||||||||||||||||||||
|
|
|||||||||||||||||||||
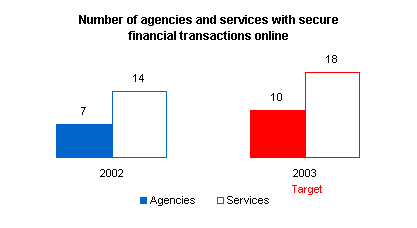
Note: The number of agencies that have implemented the Secure Financial Transaction (SFT) payment engine (providing online business transactions to citizens) has increased. Agency participation indicates an expansion to the EGS offering of the State of Minnesota and a wider variety of online transactions available to citizens. In June 2002, the Department. of Public Safety, Department of Natural Resources, the Board of Nursing, and the Chiropractic Board are using the state’s payment engine for offering Secure Financial Transaction. There are a number of agencies that offer on-line financial transactions, but utilize other payment services than the state’s SFT. These agencies are Department of Revenue, Department of Natural Resources, Department of Transportation and Department of Public Safety. The Secretary of State, Department of Transportation and Children, Families & Learning are expected to be operational offering SFT in 6 – 9 months. |
|||||||||||||||||||||
|
For more information on the Electronic Government Services initiative. For more information on the Department of Administration results. |
|||||||||||||||||||||
Time to fill state worker employment vacancies (human resources). |
|||||||||||||||||||||
|
|
|||||||||||||||||||||
Note:
Filling a vacancy in a timely manner is
important to ensure continuity of service to state agency clients as
well as to encourage the best employee candidates to remain interested
in state employment. For that reason DOER, in March of 2002, after
several years of in-depth preparation and training for agencies,
inaugurated a streamlined hiring process. The new process has greatly
automated and sped up DOER’s portion of the hiring process and provides
the agencies with new technology based tools for expediting their
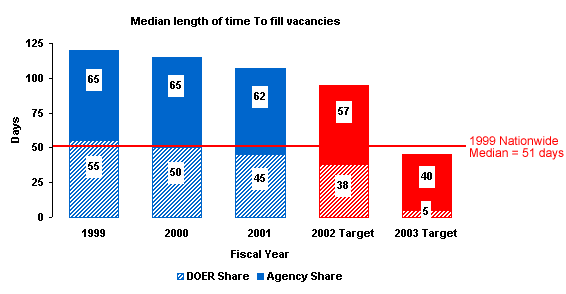
employee selection process. The indicator illustrates the time saving
impact of the new streamlined hiring process. Although some portions of
the hiring process are necessarily time-consuming, the average length of
time-to-fill should significantly decrease as agencies make greater use
of web-based hiring technology and the new streamlined hiring process to
improve efficiency. Agency time-to-fill is also affected by management
decisions about when to fill a vacancy based on budgets and internal
workforce efficiencies. *The 1999 median length of "time-to-fill" for employers nationwide is 51 days. Source: Saratoga Institute. |
|||||||||||||||||||||
| top
|
|||||||||||||||||||||
|
|
|||||||||||||||||||||
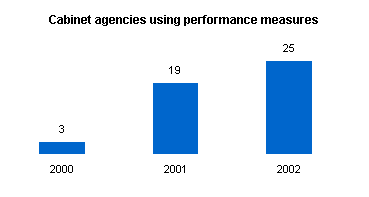
Note: The Governor is committed to the solid management of government. He has developed clear, results-oriented accountability expectations for each department, and is improving statewide structures that support departments to achieve results. Each department in state government is unique, with its own configuration, challenges and constraints. Nevertheless, broad criteria for effective results management have been developed, and the Office of Results Management is working with each department to encourage and to ensure that they are building a culture and a capacity for performance accountability. |
|||||||||||||||||||||
| top
|
|||||||||||||||||||||

