|
Improving the Competitive Position of Rural Minnesota Agriculture is a critical segment of Minnesota's economy, just as farm and rural families are an important part of our identity and culture. Today, farmers face many economic, social and environmental challenges. State agencies need to work with farmers and rural communities to help them share in the economic growth experienced in the rest of the state. State agencies should also help farmers by reducing unnecessary obstacles that limit their ability to be competitive in the world marketplace, while at the same time helping to safeguard the environment and our food supply. Likewise, we need to help make our rural communities centers of economic activity by producing employment opportunities to keep young people in their communities as well as off-farm employment to supplement farm income.
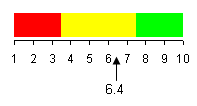
The Big Accounting Initiative Score Goal: Improve economic diversity of Greater Minnesota Economic diversity in the six regions of Greater Minnesota. Change in Minnesota off-farm wages. Goal: Expand employment opportunities for Greater Minnesota. Job growth (rate/number) in each Greater Minnesota region. Share on new jobs in under-represented sectors in Greater Minnesota. DTED facilitated expansions by businesses in under-represented sectors. Greater Minnesota's share of statewide employment Greater Minnesota's share of state business establishments and expansions |
|||||||||||||||||||||||||||||||||||||||||||||||||||||||||||||||||||||||||||||||||||||||||

|
|||||||||||||||||||||||||||||||||||||||||||||||||||||||||||||||||||||||||||||||||||||||||
|
|||||||||||||||||||||||||||||||||||||||||||||||||||||||||||||||||||||||||||||||||||||||||
|
Source: Covered Employment and Wages Program (ES-202), U.S. Department of Labor, Bureau of Labor Statistics. Calculations by the Minnesota Department of Trade and Economic Development. Note: The diversity statistic measures similarity to the national economy (the diversity benchmark). The closer the statistic is to zero, the closer the distribution of regional employment mirrors the distribution of national employment. Economic diversity is often cited as a means of surviving a downturn in a particular industry. Areas that are dependent on a few industries are seen as more vulnerable during a downturn in those industries than areas with a broader range of economic activity. For example, the Northeast region of Minnesota is the least diverse because of its dependence on mining and relatively low reliance on manufacturing and finance. An increase in Minnesota's economic diversity is generally seen as desirable. |
|||||||||||||||||||||||||||||||||||||||||||||||||||||||||||||||||||||||||||||||||||||||||
|
Learn more at: http://www.dted.state.mn.us/big-pl-prog-rpt-f.asp or http://www.dted.state.mn.us |
top
|
||||||||||||||||||||||||||||||||||||||||||||||||||||||||||||||||||||||||||||||||||||||||
|
|||||||||||||||||||||||||||||||||||||||||||||||||||||||||||||||||||||||||||||||||||||||||
|
Source: Covered Employment and Wages Program (ES-202), U.S. Department of Labor, Bureau of Labor Statistics. Consumer Price Index (CPI) data used to adjust for inflation also comes from the Bureau of Labor Statistics. Note: Real per worker off-farm wages increased in every region between 1994 and 1999. The Southwest region experienced the greatest real off-farm wage growth per worker with an 12.4 percent increase between 1994 and 1999, dramatically less than the 29 percent increase in real per worker off-farm wages in the Twin Cities metropolitan area. The Northwest, Central and Southeast regions had real per worker wage growth of between 10 and 11 percent between 1994 and 1999, while the Northeast and West Central regions had real per worker wage growth of less than 10 percent between 1994 and 1999. The table shows real (adjusted for inflation) wages per worker for six Minnesota regions. |
|||||||||||||||||||||||||||||||||||||||||||||||||||||||||||||||||||||||||||||||||||||||||
Learn more at http://www.dted.state.mn.us/big-pl-prog-rpt-f.asp or http://www.dted.state.mn.us |
top
|
||||||||||||||||||||||||||||||||||||||||||||||||||||||||||||||||||||||||||||||||||||||||
 Click for growth rates and number of jobs by economic development region. |
|||||||||||||||||||||||||||||||||||||||||||||||||||||||||||||||||||||||||||||||||||||||||
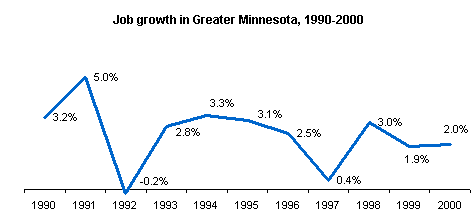
| Note: Job growth in all regions of the state is important to maintain balance between Minnesota’s urban and rural areas. Strong growth throughout the state is benefits all regions. Greater Minnesota’s regions did well in employment growth during the 1990s. Although there were declines in some years, most regions generally grew each year. | |||||||||||||||||||||||||||||||||||||||||||||||||||||||||||||||||||||||||||||||||||||||||
|
top
|
||||||||||||||||||||||||||||||||||||||||||||||||||||||||||||||||||||||||||||||||||||||||
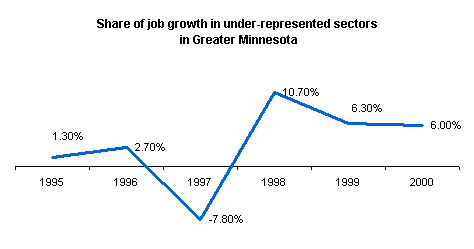
Share on new jobs in under-represented sectors in Greater Minnesota. |
|||||||||||||||||||||||||||||||||||||||||||||||||||||||||||||||||||||||||||||||||||||||||
|
Click for growth rates and number of jobs by economic development region. |
|||||||||||||||||||||||||||||||||||||||||||||||||||||||||||||||||||||||||||||||||||||||||
| Note: The ideal regional economy is generally thought to have a balanced industrial mix. However, some regions have sectors that are under-represented, meaning that they have an employment share that is less than 80 percent of the national employment share for that sector. The data on the share of new jobs in under-represented sectors is very volatile between 1995 and 2000. This indicator may become less volatile as it becomes an important consideration in DTED’s activities. | |||||||||||||||||||||||||||||||||||||||||||||||||||||||||||||||||||||||||||||||||||||||||
|
top
|
||||||||||||||||||||||||||||||||||||||||||||||||||||||||||||||||||||||||||||||||||||||||
DTED facilitated expansions by businesses in under-represented sectors. |
|||||||||||||||||||||||||||||||||||||||||||||||||||||||||||||||||||||||||||||||||||||||||
Source: Minnesota Department of Trade and Economic Development |
|||||||||||||||||||||||||||||||||||||||||||||||||||||||||||||||||||||||||||||||||||||||||
| Note: The Department of Trade and Economic Development is committed to expanding the state’s current industrial base while improving the diversity of the state’s economy. Facilitating high-quality job expansions in industries where the state is under-represented helps ensure that that the state can profit from growth throughout the economy while minimizing future economic indicators. | |||||||||||||||||||||||||||||||||||||||||||||||||||||||||||||||||||||||||||||||||||||||||
|
top
|
||||||||||||||||||||||||||||||||||||||||||||||||||||||||||||||||||||||||||||||||||||||||
|
|
|
||||||||||||||||||||||||||||||||||||||||||||||||||||||||||||||||||||||||||||||||||||||||
|
Source: Covered Employment and Wages Program (ES-202), U.S. Department of Labor, Bureau of Labor Statistics. Note: Increasing employment opportunities throughout Minnesota helps the entire state. When businesses and workers choose to be located outside the Twin Cities area, it helps the metro deal with potential congestion and urban sprawl issues. This indicator divides total employment in areas outside of the Twin Cities by total state employment. |
|||||||||||||||||||||||||||||||||||||||||||||||||||||||||||||||||||||||||||||||||||||||||
Learn more at http://www.dted.state.mn.us/big-pl-prog-rpt-f.asp or http://www.dted.state.mn.us |
top
|
||||||||||||||||||||||||||||||||||||||||||||||||||||||||||||||||||||||||||||||||||||||||
Greater Minnesota's share of state business establishments and expansions |
|||||||||||||||||||||||||||||||||||||||||||||||||||||||||||||||||||||||||||||||||||||||||
|
|
|
||||||||||||||||||||||||||||||||||||||||||||||||||||||||||||||||||||||||||||||||||||||||
|
|
|
||||||||||||||||||||||||||||||||||||||||||||||||||||||||||||||||||||||||||||||||||||||||
|
Sources: U.S. Department of Labor, Bureau of Labor Statistics. Minnesota Department of Trade and Economic Development, Analysis and Evaluation Office. Note: In order to have employment growth in Greater Minnesota, there must also be growth of businesses in these areas. Because most jobs are created by expanding businesses, this indicator examines Greater Minnesota's share of business expansions. |
|||||||||||||||||||||||||||||||||||||||||||||||||||||||||||||||||||||||||||||||||||||||||
Learn more at http://www.dted.state.mn.us/big-pl-prog-rpt-f.asp or http://www.dted.state.mn.us |
top
|
||||||||||||||||||||||||||||||||||||||||||||||||||||||||||||||||||||||||||||||||||||||||


