|
Insisting that Parents PARENT It may take a village to raise a child, but not even an entire village can make up the difference if parents do not joyfully accept their first and largest responsibility. The Ventura-Schunk administration advocates policies and programs that clearly define state government's limited role in raising our children: by returning the emphasis in the school day to classroom education; fulfilling our constitutional role of funding the best public education system we can provide; encouraging parents to be more involved in their schools and communities; continuing to cut tax burdens to give parents more time, energy and personal resources for their children; and helping parents better access the information and services available in their communities and state. There is no one department charged with implementing this initiative. The responsibility of parents to PARENT is a policy value that many departments are supporting through their programs and initiatives. The Governor and Lieutenant Governor have made it an important theme of their leadership:
|
|||||||||||||||
|
On-time child immunization rates. Percentage of current child support payments that are made on time. Uninsurance rates for children. Percentage of young children who are ready for school. (Indicator under construction) Total state and local taxes as a percent of state personal income. (The price of government) |
|||||||||||||||

|
|||||||||||||||
|
|
|
||||||||||||||
Source: Center for Health Statistics, Minnesota Department of Health Target: Reduce teen pregnancy rates from 1999 level by 15 percent before 2005. Note: Reported pregnancies include live births, fetal deaths of 20 weeks or more gestation, and induced abortions. The teenage pregnancy rate is the number of pregnancies in females age 15 to 19 per 1,000 females in the population age 15 to 19. Overall teen pregnancy rates in Minnesota overall have been slowly declining. At the same time, however, different trends in teen pregnancy are emerging in certain sub-populations. We want to make sure people are ready to be parents when they have children. Teen pregnancy has drastic consequences for both the mother and the child. Teen mothers are less likely to complete school, and are more likely to be single parents, have more medical problems and live in poverty. Children born to teen mothers have more health and behavioral problems and are more likely to receive inadequate parenting, fall victim to abuse and neglect, and have poor school performance. |
|||||||||||||||
| top
|
|||||||||||||||
|
|
|||||||||||||||
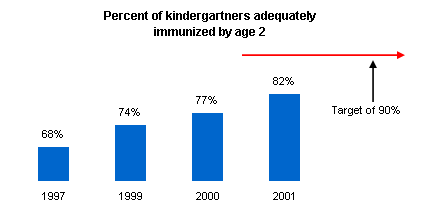
Note: Immunizations protect children from diseases that used to take their lives or permanently damage them. Just as important as getting the vaccines is getting them on time, because delays increase the risk of infection and complications. Many of Minnesota's 2-year-olds are behind schedule on their shots. Reasons may be that parents do not have health insurance, do not understand the importance of vaccination or do not know when the next shot is due. Every year parents of kindergartners are asked to submit immunization records showing compliance with Minnesota's school immunization law. The Retrospective Kindergarten Immunization Surveys analyze immunization coverage during the first two years of life, when many doses of vaccine are due and children are most vulnerable to complications from vaccine-preventable disease. There have been two comprehensive surveys in the state, in 1992-1993 and in 1996-1997. The next round of survey data should be available by summer 2002. Our target: by 2003, at least 90 percent of infants in all geographic areas, racial and ethnic groups, and socio-economic strata will receive, within two months of the recommended age, age-appropriate immunization against diphtheria, tetanus, pertussis, polio, measles, mumps, rubella, Haemophilus influenzae type B disease, hepatitis B and varicella. |
|||||||||||||||
| top
|
|||||||||||||||
Percentage of current child support payments that are made on time. |
|||||||||||||||
|
|
|||||||||||||||
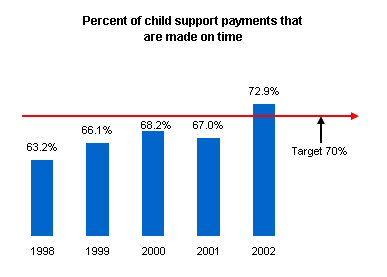
Note: When parents pay their child support on time, it is better for kids, and for the whole family. This indicator measures the total amount of ongoing (current) child support collected from noncustodial parents during a year, as compared to the total amount those parents should have paid. The measure does not include amounts parents may owe from past months or years. |
|||||||||||||||
Learn more about child support in Minnesota at: http://www.dhs.state.mn.us/newsroom/facts/childsupFS.htm |
top
|
||||||||||||||
|
|
|||||||||||||||
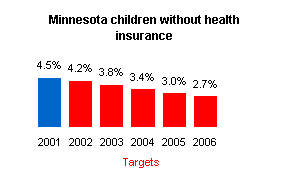
Note: Parents should be responsible to see that their children have health care coverage. For most families that can't afford health insurance, Minnesota provides Medical Assistance and MinnesotaCare. Parents still need to see that kids are enrolled, that they use the care provided, and that they get regular check-ups. This indicator measures the percentage of Minnesota children age 18 and under who lack health insurance coverage at any given point in time. Baseline information on the number of uninsured children comes from the 2001 Minnesota Health Insurance and Access Survey, sponsored by the Minnesota Department of Health and conducted by the University of Minnesota, School of Public Health. Although health insurance coverage is only one aspect of children's health, it is important for assuring that children get health care when it is needed - especially preventive care. In 2001, 4.7 percent of Minnesota children age 18 and under (approximately 64,000 children) did not have health insurance coverage. |
|||||||||||||||
The 2001 Legislature approved a Ventura administration proposal to extend health care coverage to up to 20,000 low-income children by 2005. Learn more at: http://www.dhs.state.mn.us/newsroom/facts/session/sfscoverkids.htm |
top
|
||||||||||||||
Percentage of young children who are ready for school. (Indicator under construction) |
|||||||||||||||
|
|
|||||||||||||||
Target: Develop a system to assess young children's readiness for school that includes all young children in Minnesota. Note: Parents play a crucial role in making sure that kids are ready for school. In a 1999-2000 school readiness evaluation study, kindergarten teachers rated children's adjustment to kindergarten during the first six weeks of school. Teachers were asked to identify child performance on 14 indicators in language and literacy and personal and social development. Of the 16 schools participating in the study, 88 percent of the randomly selected children were rated as making adequate adjustment to kindergarten. Legislation is needed to expand this assessment to include all children. |
|||||||||||||||
Learn more at http://cfl.state.mn.us/ecfi |
top
|
||||||||||||||
Total state and local taxes as a percent of state personal income. (The price of government) |
|||||||||||||||
|
|
|
||||||||||||||
Note: Continuing to cut tax burdens gives parents more time, energy and personal resources for their children. The price of government measures total state and local taxes, as a percent of state personal income. This is used as a measure of how much Minnesotans pay for state and local government, and can be used as a financial index to help policy-makers and taxpayers monitor the relative size of the public sector. This measure can also be used as a budgetary planning tool to assess the future fiscal impact of policy decisions. Personal income is wages, salaries, plus government transfer income and any interest income and capital gains. State and local taxes are state income tax, property tax, sales tax and use tax, and other tax revenue fees and charges. From the average taxpayer's perspective in fiscal year 2000, for every dollar of personal income, 16.6 cents went to pay for state and local taxes. Data is updated with each financial forecast provided by the Minnesota Department of Finance. The complete history of the overall state and local taxes price of government in Minnesota from state fiscal year 1991 to current is available at: http://www.finance.state.mn.us/ffeu/ |
|||||||||||||||
| top
|
|||||||||||||||


