|
THE BEST K-12 SYSTEM IN THE COUNTRY "I want to erase the word voucher from the vocabulary," were Governor Ventura's words in his first State of the State address. By these words, he focused the responsibility for delivering results squarely on every parent, every teacher, every administrator, and every school board member in Minnesota to do what is right for every child. The K-12 initiatives involve agencies as diverse as Public Safety, Metropolitan Council, Corrections, and Housing Finance in new discussions of how to improve student achievement. Three tough questions were posed by the new Governor: 1) How do we get the bang for our buck on education spending (developing a formula that is based on results, not micro-management at the classroom level); 2) What is the state's role with clearly spelling out standards and then putting accountability at each level, starting with parents and including local districts (governance and accountability); and, 3) How can we promote the use of what we already know we should do, but too often don't do (using best practices across disciplines to better align K-12 and human services, health, housing, transit, and other state investments)? The goal is simply this: to ensure the best public education for every child in Minnesota, and an optimal representative governance structure that delivers results. Lead Department: Children, Families and Learning
|
|||||||||||||||||
The Big Accounting Initiative
Score Click here to see The Big Accounting scores for all initiatives |
|||||||||||||||||
See student test scores -- by local school and district - CLASS provides parents, teachers, and all citizens with a simple method to really learn about and understand the makeup of a school or district and to see how their school stacks up against others around the state. Compare your school to other schools and other districts. Third-grade students who read at grade level. School sites fully implementing the Profile of Learning. Disciplinary incidents in schools. Rate at which ninth-grade students graduate from high school at the end of four years. Schools where at least 50 percent of teachers use the Internet for instruction. |
|||||||||||||||||

|
|||||||||||||||||
|
|
|||||||||||||||||
|
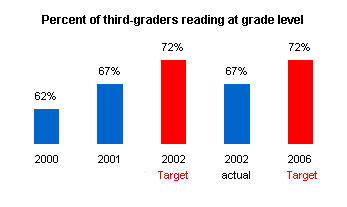
Note: Third-grade students scoring at or above 1420 on the Minnesota Comprehensive Assessment are reading at grade level, and have the knowledge and skills to perform third-grade level work. Third-grade students are required to take MCA math and reading tests in March. The scores determine how well Minnesota schools are performing in meeting the Minnesota High Standards. Why is this indicator important? Reading proficiency is a foundational skill for all learning. The lack of proficiency in reading by the end of third grade is a strong predictor of future academic risk. Research shows that if students do not learn to read well and independently by the end of third grade, the likelihood of them ever reaching a proficient level of reading decreases significantly. In addition, states are now being ranked by the U.S. Department of Education on this indicator and future funding under the Reading First program is dependent upon improvements in this indicator. What is the State doing?
Is the State meeting the target? The same percentage of third-graders are reading at grade level in 2002 as were reading in 2001 falling short of the target of 72% set for 2002. |
|||||||||||||||||
Learn more at http://cfl.state.mn.us/GRAD/results.html and ahttp://cfl.state.mn.us/newsrel/ayp.html |
top
|
||||||||||||||||
|
|
|||||||||||||||||
|
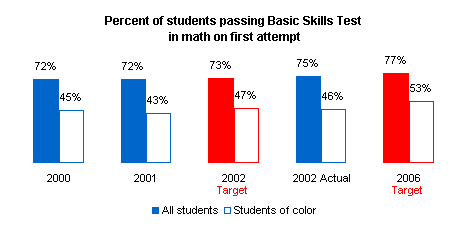
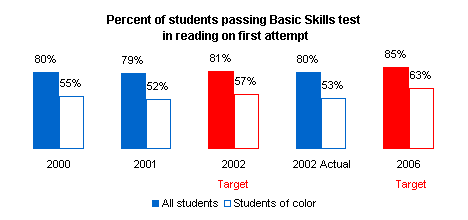
Note: The Basic Skills Test (BST) is given for the first time to eighth-grade students every winter and published in February of each year. Why is this indicator important? The Basic Skills Tests (BST) in reading and mathematics test knowledge of curriculum introduced in the sixth grade with the expectation that students will have mastered it by the 8th grade. This represents the minimum level of essential skills expected of every Minnesota student to graduate from high school and to make it in the working world. Students take the test for the first time in the eighth grade and are expected to pass at this point. This indicator tells the state how many students heading into 9th grade have yet to attain the skills required to receive a high school diploma. School districts have plenty of time to meet the needs of these students to ensure that they can graduate with functional skills in math and reading. Students are provided 11 opportunities to pass the BST. What is the State doing?
Is the State meeting the target? The percentage of all students passing the BST in reading on their first attempt increased from 79% to 80% but fell short of a target of 81%. The percentage of students of color who passed the BST in reading on their first attempt increased from 52% to 53% but fell short of a target of 57%. The percentage of all students passing the BST in mathematics on their first attempt increased from 72% to 75% exceeding the target of 73%. The percentage of students of color who passed the BST in mathematics on their first attempt increased from 43% to 46% falling short of a target of 47%. |
|||||||||||||||||
Learn more at http://cfl.state.mn.us/GRAD/results.html |
top
|
||||||||||||||||
|
|
|
||||||||||||||||
|
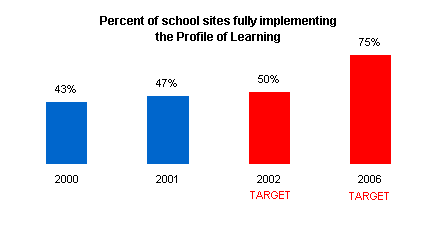
Why is this indicator important? The graduation standards define what students should know, understand and be able to do to demonstrate advanced skills in ten learning areas. The content in the standards was identified through extensive involvement of teachers and through public forums. What is the State doing? CFL assigned a graduation standards technician to every school district who is charged with providing feedback to CFL regarding the dissemination and implementation of graduation standards. CFL also assigned content specialists in each of the ten learning areas, to assist teachers with curriculum design aligned with the standards. Content specialists also work with teachers to develop instructional strategies, and to design classroom assessments. CFL uses test scores from the Basic Skills Tests and the Minnesota Comprehensive Assessment to identify schools needing additional support and resources. Is the State meeting the target? Due to legislation adopted in 2000, full implementation of the graduation standards (24 standards required for graduation) has slowed. The legislation gave districts an open timeline to schedule implementation with no deadline for full implementation. As a result, most of the state’s districts anticipate they will take much longer to require students to meet 24 standards for graduation. |
|||||||||||||||||
Learn more at http://cflapp.state.mn.us/apps/reportonprofile/index.html |
top
|
||||||||||||||||
|
|
|
||||||||||||||||
|
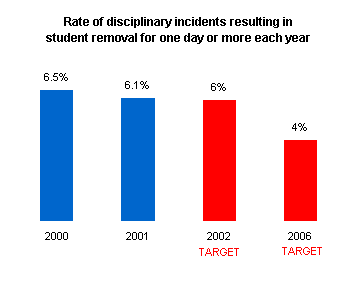
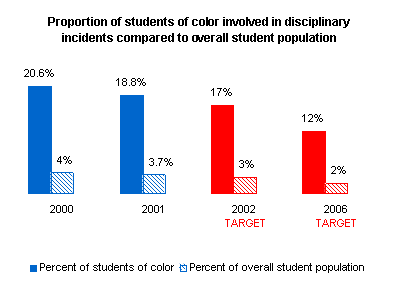
Why is this indicator important? Reportable disciplinary incidents are those that result in the removal of the student from school for one full day or more (there may be suspensions or expulsions). The rate of the disciplinary incidents is the number of incidents divided by the number of students enrolled. For example, a 6 percent rate of disciplinary incidents means that for every 100 students enrolled there were 6 disciplinary incidents leading to a suspension of one day or more. The Minnesota Pupil Fair Dismissal Act, first passed in 1974, outlines policies and procedures on exclusion, expulsion and suspension. Each school district is required to establish reasonable uniform criteria for the formal dismissal of pupils. Students are typically expelled for willfully engaging in dangerous, disruptive or violent behavior, including possessing a firearm in a school zone. Each year, Minnesota students are dismissed from school over 100,000 times. This includes students dismissed through formal suspension or expulsion which generate over 40,000 reports to CFL each year. While dismissal is a critical tool for school administrators in maintaining a safe and conducive learning environment, it is often overused. Further, it is often used as an alternative to examining the root of the disruptive behavior and addressing it. For example, dismissal frequently serves to remove students from school instead of examining the extent to which the student may have an unidentified disability. Finally, dismissal often has a disproportionate effect on students of color and students with disabilities. What is the State doing? The Department of Children, Families and Learning sponsors violence prevention and intervention, bullying awareness and other programs aimed at reducing disciplinary incidents in schools. CFL also provides training opportunities to thousands of school staff describing appropriate implementation of the PFDA and alternatives to traditional discipline. In addition, CFL supported legislation designed to force school staff to track dismissals more closely and to meet with parents in those cases where an individual student was dismissed more than 10 cumulative days in a school year. The purpose of the meeting is to examine the extent to which the dismissals have proven effective in addressing the student’s behavior and to consider the need for assessment and other services. Is the State meeting the target? Data for 2002 is not available. |
|||||||||||||||||
Learn more at http://cfl.state.mn.us/dmc/ |
top
|
||||||||||||||||
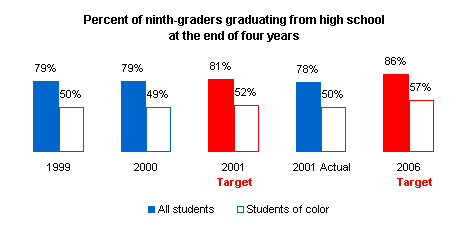
Rate at which ninth-grade students graduate from high school at the end of four years. |
|||||||||||||||||
|
|
|||||||||||||||||
|
Note: Data is gathered as part of the Completion
Study, a pioneering effort started in 1992, to track individual students
in the Minnesota public school system over a four-year period. Results
were first available in 1996 and are now published in the fall of each
year. Why is this indicator important? Graduation from high school provides a critical foundation for all youth to become minimally productive citizens capable of living and working in an increasingly complex, heterogeneous world. What is the State doing? Efforts to accomplish this outcome are embodied in many if not most of CFL programs and services. In addition to improving standards-based teaching and learning, CFL: works to identify schools/students in need of additional resources, provides support for at-risk learners, provides an array of learning options and alternatives including adult basic education, charter schools, post-secondary options, and provides funding for a variety of programs designed to create safe, violence free learning environments – all designed to improve the chances of children successfully completing high school or its equivalency. Is the State meeting the target? 78% of all students graduated from high school in 2001 down from 79% who graduated in 2000 falling short of a target of 81%. 50% of students of color graduated in 2001 up from 49% of students of color who graduated in 2000 falling short of a target of 52%. These numbers do not include the students who dropped out of high school and subsequently earned a state of Minnesota GED diploma during the same time frame. According to the Census Bureau, at 89.5 percent, Minnesota had the highest rate (in the nation) of persons age 25 and over with a high school diploma or equivalent in 2000. The national rate was 81.6 percent in 2000. |
|||||||||||||||||
Learn more at http://cfl.state.mn.us/datactr/compstu/index.htm |
top
|
||||||||||||||||
|
|
|||||||||||||||||
|
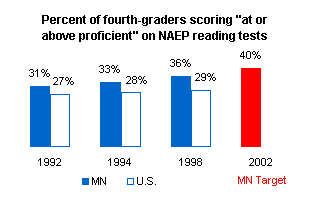
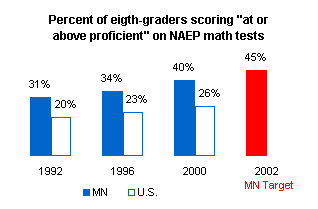
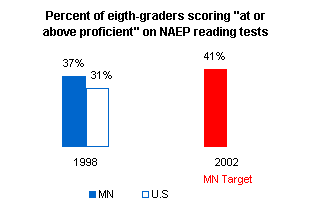
Why is this indicator important? NAEP is the only truly national assessment of school outcomes. It allows comparison of the performance of Minnesota students with those in other states in reading and math at both the fourth and eighth - grade levels. The NO CHILD LEFT BEHIND legislation passed in 2001 stipulates that NAEP be considered by each state as a "second indicator" (in addition to the data collected by the state's own assessment system) when judging the quality of the educational outcomes. The NCLB legislation also mandates that NAEP tests in reading and math be administered at grades 4 and 8 every other year beginning in 2003. What is the State doing? A NAEP coordinator has recently been added to the Division of the Minnesota Statewide Assessment within CFL. The primary duties of the coordinator consist of increasing awareness of the importance of NAEP and encouraging participation of Minnesota schools that are selected in the NAEP sample. At least 85% (raised from 70% in past assessments) of the schools in a state sample must participate in order for NAEP to report results for the state. Is the State meeting the target? It is anticipated that Minnesota will continue to be among the top half dozen states in future NAEP testings. There should also be an increase in the percentage of students who score "at or above proficient". |
|||||||||||||||||
Learn more at http://www.nces.ed.gov/nationsreportcard |
top
|
||||||||||||||||
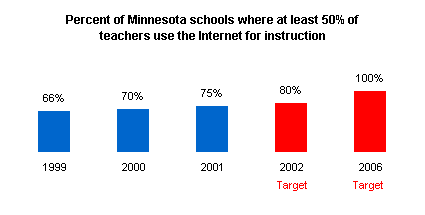
Schools where at least 50 percent of teachers use the Internet for instruction. |
|||||||||||||||||
|
|
|||||||||||||||||
|
Why is this indicator important? Using the Internet as an
instructional resource is important because the Internet provides a wide
array of resources for students and teachers, and in many cases offers
resources far beyond those that would be available in a student or
teacher's immediate geographic area. It also enables teachers and
students to participate more in a global educational community that is
not constricted by geographic boundaries or building walls What is the State doing? CFL promotes the use of the Internet, and technology in general, as a tool for instruction. Like most tools, the effectiveness of the technology depends on how it is used. CFL provides outreach on technology planning and integration and operates federal technology literacy programs on behalf of the U.S. Department of Education to foster best practices and to target schools serving higher populations of students in poverty. CFL also helps schools and districts take advantage of discounted "E" rates" for internet access to schools and libraries, as well as other programs to increase the use of the Internet for instruction. To improve this indicator, districts and schools need to ensure that classrooms are wired and that new, more powerful computers are available. In addition, teachers need staff development training and time to adapt to the Internet. Education Week annually issues "Technology Counts" an assessment that provides state and national information on access and use of technology by students, teachers and schools. Is the State meeting the target? Yes, CFL's work is helping to meet the target. |
|||||||||||||||||
Learn more at http://www.edweek.org/sreports |
top
|
||||||||||||||||
|
Why is this indicator important? The National Education Goals Panel (NEGP) and Minnesota’s own Early Childhood Indicators of Progress report include five domains of readiness for a child: the child’s health and physical development; social and emotional development; approaches toward learning; language development and communicative skills; cognition and general knowledge. Minnesota recognizes a sixth domain: creativity and the arts. NEGP and Child Trends also identify two other components of school readiness: school’s readiness for children and family, and community supports that contribute to children’s readiness. What is the State doing? CFL is piloting a survey of kindergarten children in a representative sample of Minnesota schools to assess their readiness in these identified domains. A customized version of the Work Sampling System Developmental Checklist will be used to collect this data along with demographic information on race/ethnicity, gender, poverty, English Language Learners, and Special Education status. The results of the pilot survey will provide aggregate data to profile children’s proficiency across the developmental domains at the time of entering Kindergarten. In later phases, the profile will be expanded to include school’s readiness for children and community supports. CFL is exploring the feasibility to add an early childhood data system to the current K-12 data system. Is the State meeting the target? The purpose of their project is to develop a system that assesses young children’s readiness for school that includes all young children in Minnesota. The results from the pilot study will be published in January 2003. Legislative appropriation of resources is needed for the further development of early childhood data collection, analysis, and links to other datasets. Without legislative support, CFL does not have adequate resources to include assessment of all young children in Minnesota. |
|||||||||||||||||
Learn more at http://cfl.state.mn.us/ecfi |
top
|
||||||||||||||||
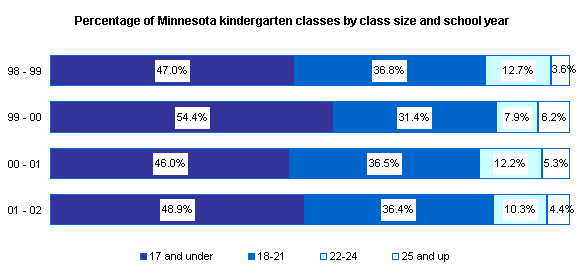 Note: Average kindergarten class size in Minnesota was 17.7 children in the 1998-1999 school year and 18.0 children in the 2001-2002 school year. |
|||||||||||||||||
 Note: Average first grade class size in Minnesota was 19.3 children in the 1998-1999 school year and 19.3 children in the 2001-2002 school year. |
|||||||||||||||||
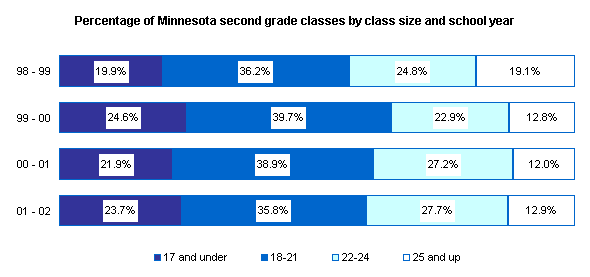 Note: Average second grade class size in Minnesota was 21.3 children in the 1998-1999 school year and 20.7 children in the 2001-2002 school year. |
|||||||||||||||||
|
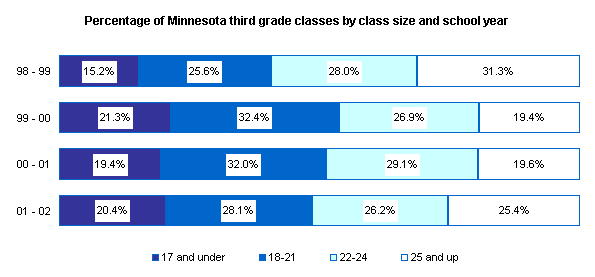
Note: Average third grade class size in Minnesota was 22.7 children in the 1998-1999 school year and 21.7 children in the 2001-2002 school year. |
|||||||||||||||||
|
Why is this indicator important? Some research has shown that more individual attention provided in grades K-3 results in higher student achievement, fewer behavior problems and fewer special education placements. What is the State doing? State and federal class size reduction funding are managed and monitored by CFL. Pursuant to Federal Class Size Reduction Act passed in 1999, CFL applied for and administered federal class size reduction funding totaling approximately $56 million over a three-year period. The program was recently eliminated under the No Child Left Behind Act of 2001 and the funding rolled into another federal program. Districts will be allowed to continue reducing class sizes under the new program if it is a district priority. The 1999 legislature approved the Governor’s request for $50 million a year in additional funding for class size reduction but did not restrict the funding for those purposes. The Omnibus K-12 Education Act of 2001 approved changes that clearly earmarked funds for K-3 class size reduction. It also clarified the definition of classroom teacher and average class size for purposes of computing class size. District average sizes in grades K-6 are required to be reported to the Commissioner by December 15 of each year after providing a public report by December 1 to district residents. Additional funding and resources would be needed to develop and maintain a data collection system to more accurately analyze the hard data provided by school districts. Is the State meeting the target? A target of an average class size of 17 for K-3 has been set by statute, as recommended by the Governor in 1999. The infusion of federal and state class size reduction money resulted in a measurable increase in the number of schools that had class sizes of 17 in 1999-2000. The percentage of schools that have 17 or fewer students in their classes has, however, gone down since. |
|||||||||||||||||
|
top
|
||||||||||||||||