|
Independent Living Limitations due to age, physical or mental condition prevent some members of our communities from achieving complete self-sufficiency. Our goal, however, should be a life as independent and self-sufficient as possible. Elderly people should have the opportunity to live in their homes as long as possible and, when that is no longer feasible, to receive the care they need - both from their families and from professional caregivers - in a setting that is as supportive as possible. Minnesota needs policies and programs that reflect this perspective and serve our elderly well, but without excessive burden on our society. This will be a growing challenge as the population over age 65 doubles in the next 30 years, while the number of people of working age shrinks. People with disabilities, in turn, suffer a high level of unemployment - a serious problem to them and a loss of their skills to an economy that is struggling to find sufficient workers. The state needs improved strategies to bring disabled people into the workplace in larger numbers, ensuring the possibility for them to become as self-sufficient as possible.
|
||||||||||||||||||||||
The Big Accounting Initiative
Score People with disabilities under age 65 on the Medical Assistance program in an institutional setting. People over age 65 on the Medical Assistance program in an institutional setting. People of all ages who are less disabled in nursing facilities. Number of "supportive housing" units per 1,000 people over age 65. |
||||||||||||||||||||||

|
||||||||||||||||||||||
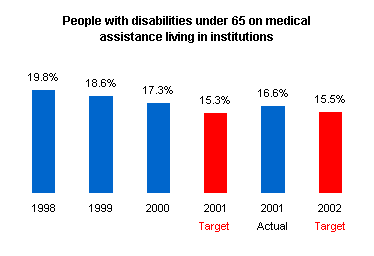
People with disabilities under age 65 on the Medical Assistance program in an institutional setting. |
||||||||||||||||||||||
|
|
|
|||||||||||||||||||||
Note: Institutional settings are defined as nursing facilities, intermediate care facilities for people with development disabilities, regional treatment centers and hospitals being used as a permanent home. The state wants to reduce the percent of people who must live in institutional settings because of their disabilities, and increase the percent living in the community, so they can be more independent and integrated into the community. |
||||||||||||||||||||||
Learn more at: http://www.dhs.state.mn.us/newsroom/facts/session/sfsltc.htm |
top
|
|||||||||||||||||||||
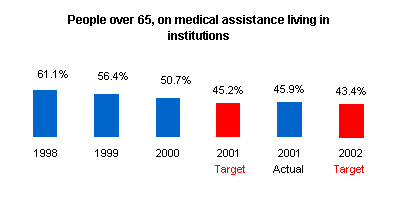
People over age 65 on the Medical Assistance program in an institutional setting. |
||||||||||||||||||||||
|
|
|
|||||||||||||||||||||
Note: Consumers increasingly prefer to live in a community rather than institutional settings. Reducing the number of older people who must move to an institutional setting for care is an important state goal. The department wants to make it more possible for people to live in their own homes, apartments and communities, and receive needed assistance in those settings. Institutional settings are defined as nursing facilities, intermediate care facilities for people with development disabilities, regional treatment centers and hospitals used as a permanent home. |
||||||||||||||||||||||
Learn more about the 2001 long-term care legislation at: http://www.dhs.state.mn.us/newsroom/facts/session/sfsltc.htm Learn more about the long-term care task force at: http://www.dhs.state.mn.us/agingint/ltctaskforce/default.htm |
top
|
|||||||||||||||||||||
|
|
|
|||||||||||||||||||||
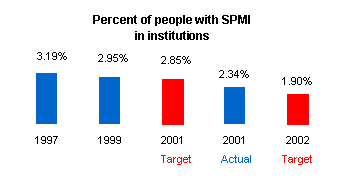
Note: An important state policy goal is to reduce the percent of people with mental illness served by the public sector in institutional settings, and increase the percent served in their communities, through community-based options. Institutional settings include regional treatment centers and other similar facilities. |
||||||||||||||||||||||
| top
|
||||||||||||||||||||||
|
|
|
|||||||||||||||||||||
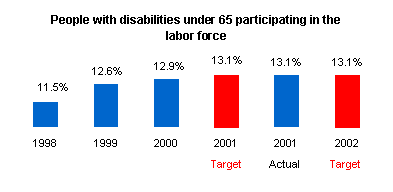
Note: This measures the percent of people under 65 with disabilities and served by Medical Assistance, who participate in the labor force. In the past, many people with disabilities have been unable to participate in the labor force because income from employment made them ineligible for essential services and assistance they need for community living. Recent changes in the medical assistance program have removed these negative incentives and made it possible for these individuals to receive essential services and participate in the labor force. An important state policy goal is to increase the labor force participation rate among groups that have experienced barriers in the past, including people with disabilities. |
||||||||||||||||||||||
| top
|
||||||||||||||||||||||
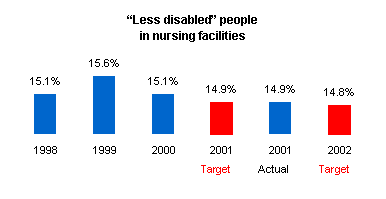
People of all ages who are less disabled in nursing facilities. |
||||||||||||||||||||||
|
|
|
|||||||||||||||||||||
Note: This measures the percent of all people in nursing facilities who are "less disabled"* and thus need a smaller amount of assistance with activities of daily living. As community services and housing options for people with disabilities expand, those with fewer disabilities should be able to remain in community settings longer, and thus the percent with lighter care needs in nursing facilities should decrease. An important state policy goal is to expand the variety and type of long-term care services available to people with disabilities across Minnesota, so that they can choose to remain in their homes, apartments and communities, and receive needed services there as long as possible. *These persons have fewer functional problems and are classified as Case Mix "A" on a scale from "A" to "K," from lighter care needs to heavier care needs. This data is provided to Department of Human Services and Department of Health. There is usually about a 12-month lag in obtaining year-end data. |
||||||||||||||||||||||
| top
|
||||||||||||||||||||||
|
|
|
|||||||||||||||||||||
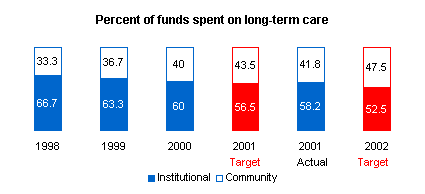
Note: This indicator compares public spending on institutional care and community service for all people with disabilities. In the past, public funds were largely spent on institutional care, reducing the amount available for community services. The department strives to provide more community choices and options for people who need long-term care, because this is what consumers prefer. |
||||||||||||||||||||||
Learn more at: http://www.dhs.state.mn.us/newsroom/facts/session/sfsltc.htm |
top
|
|||||||||||||||||||||
|
|
|
|||||||||||||||||||||
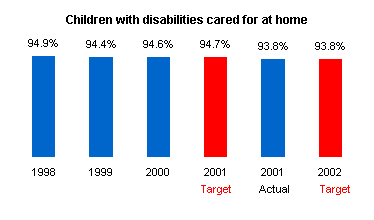
Note: Whenever possible, children with disabilities should be able to live at home with their natural or adoptive families. In the past, supports have often been more available for institutional placement or other out-of-home placement than within family settings. An important state policy goal is to provide supports to the natural or adoptive families of children with disabilities so that these children can remain in a family setting, which is what both the family and children prefer. |
||||||||||||||||||||||
| top
|
||||||||||||||||||||||
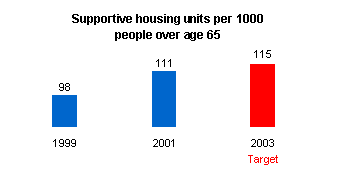
Number of "supportive housing" units per 1,000 people over age 65. |
||||||||||||||||||||||
|
|
|
|||||||||||||||||||||
Note: This measures the availability of supportive housing for people over age 65 across the state. Specifically, the indicator measures the ratio of housing per 1,000 people over age 65, calculated by dividing the total number of units available by the total number of people over 65 in the state. Supportive housing is defined as all housing specifically developed and built to serve older people, excluding nursing homes. Both publicly owned and supported as well as market rate housing options are included, such as senior apartment buildings, board and lodge facilities, assisted living facilities, foster care and continuing care retirement centers. Once an inventory of supportive housing available to people under 65 with disabilities has been completed, this benchmark will be revised to a ratio that compares available housing units to all people with disabilities. |
||||||||||||||||||||||
| top
|
||||||||||||||||||||||