|
Partnerships for Affordable Housing Continued strong economic growth in Minnesota depends on an adequate supply of housing that the workforce can afford. Plant expansion and job growth can come to a stop if employees cannot find housing near their work. Existing businesses may relocate if long commutes contribute to high workforce mobility or if deteriorating neighborhoods undermine the community's appeal for workers and customers. Where the private sector alone cannot produce housing for everyone, the public sector must act in partnership with communities, developers, employers, lenders, churches, schools and residents to develop housing that is an asset to the community and a necessary support for a vital economy. The goal of the Partnerships for Affordable Housing initiative is to increase the production of affordable housing necessary to sustain economic growth by increasing investment from all partners, and removing barriers to development.
|
|||||||||||||||||||||
The Big
Accounting Initiative Score Leverage of nonstate resources in affordable housing development projects. Cost reductions in affordable housing development projects due to local regulatory relief. |
|||||||||||||||||||||

|
|||||||||||||||||||||
Leverage of nonstate resources in affordable housing development projects. |
|||||||||||||||||||||
|
|
|||||||||||||||||||||
|
|||||||||||||||||||||
 |
|||||||||||||||||||||
|
|
|||||||||||||||||||||
|
|||||||||||||||||||||
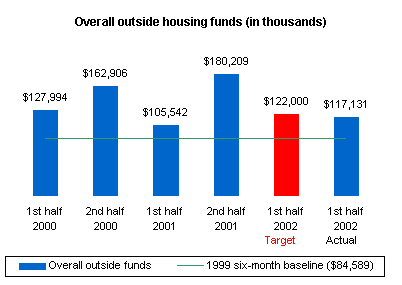
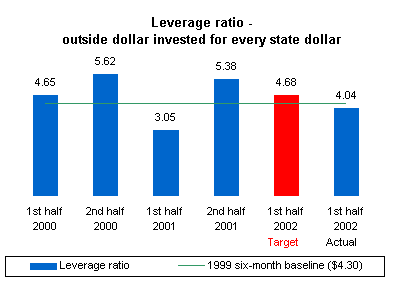
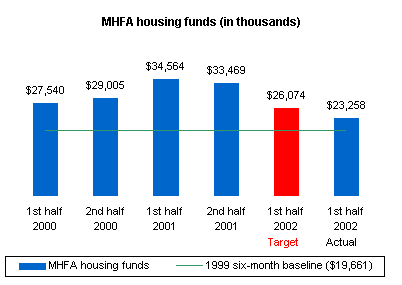
Note: The state leverages its resources with private sector resources to maximize investment in affordable housing. The supply of workforce housing will not be increased without capital investment from more, and different, partners in affordable housing development. The first and second graphs reflect the funding of affordable housing both with MHFA and outside funds. In each year since the Agency began tracking this indicator, the investment of nonstate resources significantly exceeded the baseline. Since the volume of housing development business tends to be stronger in the last six months of the calendar year, we created a six-month baseline for 1999 that is half of the overall business for that year. Fluctuations in performance results are affected by a variety of factors including appropriations of one-time funds for specified purposes. The third graph, the leverage ratio, reflects that the ratio of outside dollars invested in affordable housing for each state dollar remains reasonably positive. Ongoing improvement on this indicator is a key focus of the Agency's efforts. |
|||||||||||||||||||||
|
Learn more at http://www.mhfa.state.mn.us top
|
|||||||||||||||||||||
 |
|||||||||||||||||||||
 |
|||||||||||||||||||||
|
|||||||||||||||||||||
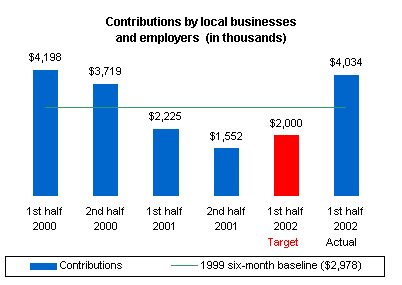
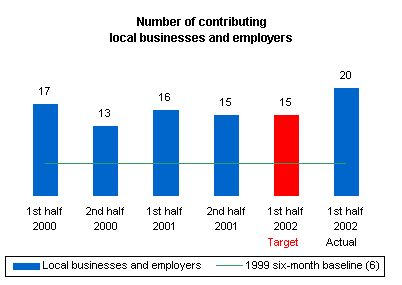
Note: The supply of workforce housing will not be increased with governmental and philanthropic funding alone. Meeting the workforce housing challenge requires involvement from local businesses and employers. The Administration works to encourage increased housing investment from these sources. The dollar amount of investment by local businesses and employers in affordable housing development projects in the first half of 2002 is more than double the target established for that time period, and is the second highest amount achieved since the baseline was set. In both dollar amount and number, 2002 local business and employer investment far outpaced performance in 2001. Since the volume of housing development business tends to be stronger in the last six months of the calendar year, we created a six-month baseline for 1999 that is half of the overall business activity for that year. |
|||||||||||||||||||||
| top
|
|||||||||||||||||||||
Cost reductions in affordable housing development projects due to local regulatory relief. |
|||||||||||||||||||||
|
|
|||||||||||||||||||||
|
|||||||||||||||||||||
|
|
|||||||||||||||||||||
|
|||||||||||||||||||||
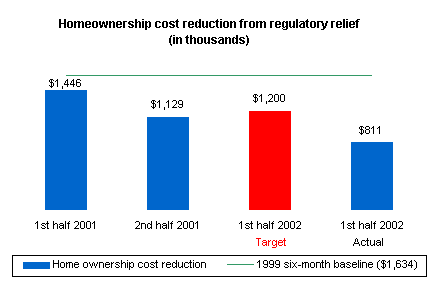
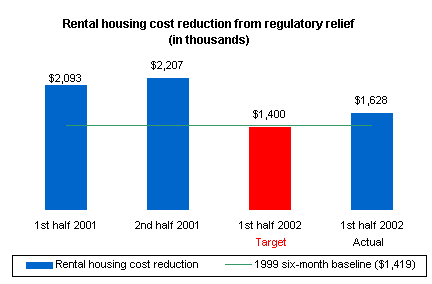
Note: Although we will never eliminate the need for public funding, strategies other than subsidies must be used for producing workforce housing. The Administration works to reduce unnecessary costs so that we can increase production of workforce housing that does not need public funding, and make the public funding that does exist go farther. Local governments can contribute to reducing costs and increasing private, unsubsidized development by reducing or eliminating restrictive regulations that serve as barriers to development, such as density requirements, lot sizes, fees and zoning limits. The considerable amount of regulatory relief achieved, even in challenging financial times, reflects the strong commitment we attach to this type of contribution in prioritizing development projects. Since the volume of housing development business tends to be stronger in the last six months of the calendar year, we created a six-month baseline for 1999 that is half of the overall business for that year. |
|||||||||||||||||||||
| top
|
|||||||||||||||||||||

