|
Commercialization of New Technologies Technology advancement and applications can lead to increased productivity and competitiveness of today's businesses and to the start-up of businesses that become tomorrow's economic giants - and giant employers. As part of our global readiness strategy, we need to help maximize access to technology and the commercialization of new technologies. We also need to encourage the successful transfer of research and technology from our state's major research university and other research institutions in the private sector.
|
|||||||||||||||||||||||||||||||||||||||||||||||||||||||||||||||||||||||||||||||||
The Big Accounting Initiative
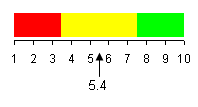
Score Goal: Increase innovation in Minnesota. Number of new patents issued and attributable to Minnesota activities. Level of Minnesota research and development expenditures by industry and academia. Goal: Improve technology transfer from academia to industry. Number of University of Minnesota licensing agreements with the private sector. |
|||||||||||||||||||||||||||||||||||||||||||||||||||||||||||||||||||||||||||||||||

|
|||||||||||||||||||||||||||||||||||||||||||||||||||||||||||||||||||||||||||||||||
Number of new patents issued and attributable to Minnesota activities. |
|||||||||||||||||||||||||||||||||||||||||||||||||||||||||||||||||||||||||||||||||
|
|
|
||||||||||||||||||||||||||||||||||||||||||||||||||||||||||||||||||||||||||||||||
| Note: Patents protect the ability of inventors and developers to profit from their innovations. Patents are granted to new ideas which translate to growing businesses. The administration is working to increase the number of patents granted to Minnesota people and businesses. The number of patents issued to Minnesota entities increased every year except 1995, and Minnesota's share of U.S. patents increased between 1990 and 1998. Patents increased 103 percent in Minnesota between 1990 and 2000, while patents granted nationally only increased 83 percent. (Data from the U.S. Department of Commerce, Patent and Trademark Office.) | |||||||||||||||||||||||||||||||||||||||||||||||||||||||||||||||||||||||||||||||||
Learn more at http://www.dted.state.mn.us/big-pl-prog-rpt-f.asp or http://www.dted.state.mn.us |
top
|
||||||||||||||||||||||||||||||||||||||||||||||||||||||||||||||||||||||||||||||||
Level of Minnesota research and development expenditures by industry and academia. |
|||||||||||||||||||||||||||||||||||||||||||||||||||||||||||||||||||||||||||||||||
|
|
|
||||||||||||||||||||||||||||||||||||||||||||||||||||||||||||||||||||||||||||||||
Note: Research and development funds stimulate innovation, and innovation stimulates the state's economy. The administration is working to create a business and academic climate that is helpful to R&D. Total Minnesota research and development increased 71 percent between 1991 and 1998, while nationally, funding increased only 41 percent. Industry R&D as a percent of the state's total increased during the baseline period. Academic R&D as a percent of the state's total decreased during the baseline period. (Data from the National Science Foundation.) |
|||||||||||||||||||||||||||||||||||||||||||||||||||||||||||||||||||||||||||||||||
Learn more at http://www.dted.state.mn.us/big-pl-prog-rpt-f.asp or http://www.dted.state.mn.us |
top
|
||||||||||||||||||||||||||||||||||||||||||||||||||||||||||||||||||||||||||||||||
Number of University of Minnesota licensing agreements with the private sector. |
|||||||||||||||||||||||||||||||||||||||||||||||||||||||||||||||||||||||||||||||||
|
|
|
||||||||||||||||||||||||||||||||||||||||||||||||||||||||||||||||||||||||||||||||
Note: The University of Minnesota often does not have the ability to make full use of new technologies and other innovations that come from staff. The university enters into licensing agreements with companies which then develop and sell the its product. In return, the company agrees to pay a certain portion of its profits to the university. This arrangement ensures commercialization of new ideas and technologies and provides additional funding for research and education. Licensing agreements generally grew during the 1990s; each year, less than half of all university agreements were with Minnesota companies. |
|||||||||||||||||||||||||||||||||||||||||||||||||||||||||||||||||||||||||||||||||
Learn more at http://www.dted.state.mn.us/big-pl-prog-rpt-f.asp or http://www.dted.state.mn.us |
top
|
||||||||||||||||||||||||||||||||||||||||||||||||||||||||||||||||||||||||||||||||


