|
The Best Climate to Grow Business For Minnesota to be competitive in today's global environment, our business development initiatives need to focus on high growth industries and high quality jobs. Minnesota's business will continue to prosper with a supportive business environment. The best business we have is the business we have today. We need to do everything we can to make sure healthy businesses stay in Minnesota - and expand in Minnesota. And we need to encourage and facilitate relationships and resources between community leadership and businesses to ensure expansion occurs statewide. In today's increasingly mobile and evolving business world, we must help to generate new entrepreneurs and enterprises. To give new businesses every chance to grow into major employers, we need programs that speak directly to their needs for capital, for technology, and for entrepreneurial skills and expertise.
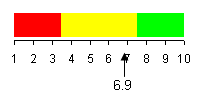
The Big Accounting Initiative Score Goal: Improved economic well-being for Minnesotans. Real per capita percent growth in Minnesota's gross state product (GSP). Goal: Continued growth in Minnesota businesses. Net gain in the number of Minnesota's business establishments. Goal: Improve Minnesota's high-tech competitiveness. Minnesota's share of high-tech jobs in the United States. Minnesota's share of U.S. high-tech job growth Minnesota's high-tech job growth (rate and actual number) compared with U.S. High tech job creation facilitated by the Department. Goal: Increase the diversity of Minnesota's economy. Diversity of Minnesota's economy Share of new jobs that are in under-represented sectors Business expansions in under-represented sectors facilitated by the Department Minnesota's net job growth (rate and number) Goal: Increase rate of cutting-edge start-up business development. Percentage of national venture capital invested in Minnesota. Start-up rate for new business Goal: Improve perception of Minnesota's business climate. Grades on state's report card from the Corporation for Enterprise Development. |
|||||||||||||||||||||||||||||||||||||||||||||||||||||||||||||||||||||||||||||||||||||||||||||||||||||||||||||||

|
|||||||||||||||||||||||||||||||||||||||||||||||||||||||||||||||||||||||||||||||||||||||||||||||||||||||||||||||
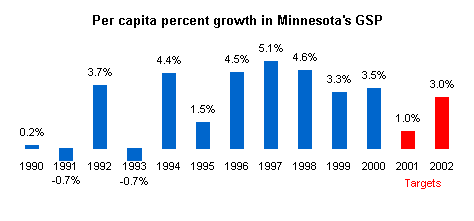
Real per capita percent growth in Minnesota's gross state product (GSP). |
|||||||||||||||||||||||||||||||||||||||||||||||||||||||||||||||||||||||||||||||||||||||||||||||||||||||||||||||
|
|
|||||||||||||||||||||||||||||||||||||||||||||||||||||||||||||||||||||||||||||||||||||||||||||||||||||||||||||||
|
|||||||||||||||||||||||||||||||||||||||||||||||||||||||||||||||||||||||||||||||||||||||||||||||||||||||||||||||
Source: U.S. Department of Commerce, Bureau of Economic Analysis. Note: Minnesota's economy grew 50 percent in real terms between 1990 and 2000, compared to 40 percent growth nationally. Real per capita growth in the GSP means that Minnesota's economy is growing, even when inflation and population growth are accounted for. This should translate into greater economic well-being, on average, for Minnesotans. |
|||||||||||||||||||||||||||||||||||||||||||||||||||||||||||||||||||||||||||||||||||||||||||||||||||||||||||||||
Learn more at http://www.dted.state.mn.us/big-pl-prog-rpt-f.asp or http://www.dted.state.mn.us |
top
|
||||||||||||||||||||||||||||||||||||||||||||||||||||||||||||||||||||||||||||||||||||||||||||||||||||||||||||||
Net gain in the number of Minnesota's business establishments. |
|||||||||||||||||||||||||||||||||||||||||||||||||||||||||||||||||||||||||||||||||||||||||||||||||||||||||||||||
|
|
|||||||||||||||||||||||||||||||||||||||||||||||||||||||||||||||||||||||||||||||||||||||||||||||||||||||||||||||
|
|||||||||||||||||||||||||||||||||||||||||||||||||||||||||||||||||||||||||||||||||||||||||||||||||||||||||||||||
Source: Covered Employment and Wages Program (ES-202), U.S. Department of Labor, Bureau of Labor Statistics. Calculations by the Minnesota Department of Trade and Economic Development. Note: The number of Minnesota business establishments increased every year during the 1990s. An increase in business establishments tends to indicate economic health, as the number of start-up businesses is larger than the number of business closures. |
|||||||||||||||||||||||||||||||||||||||||||||||||||||||||||||||||||||||||||||||||||||||||||||||||||||||||||||||
Learn more at http://www.dted.state.mn.us/big-pl-prog-rpt-f.asp or http://www.dted.state.mn.us |
top
|
||||||||||||||||||||||||||||||||||||||||||||||||||||||||||||||||||||||||||||||||||||||||||||||||||||||||||||||
|
|
|||||||||||||||||||||||||||||||||||||||||||||||||||||||||||||||||||||||||||||||||||||||||||||||||||||||||||||||
|
|||||||||||||||||||||||||||||||||||||||||||||||||||||||||||||||||||||||||||||||||||||||||||||||||||||||||||||||
|
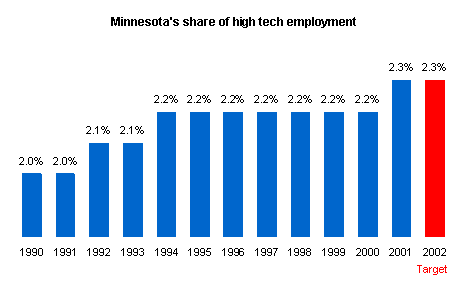
Source: Covered Employment and Wages Program (ES-202), U.S. Department of Labor, Bureau of Labor Statistics. Calculations by the Minnesota Department of Trade and Economic Development. Note: High-tech industries from manufacturing to services need highly skilled workers. These jobs accounted for a growing share of Minnesota employment in the 1990s. This indicates that we are improving wage levels, becoming more technology-oriented and more able to compete for these industries with other states. Minnesota is one of 14 states with proportionally more high-tech jobs than its share of the U.S. population. Three factors were considered when defining high-tech industries: 1) R & D spending; 2) percentage of scientist and engineer employees in the workforce; and 3) dependence on proprietary intellectual capital. Given recent economic and business changes, this definition will be reviewed in coming months. A list of the current industries can be found on page 29 at http://www.dted.state.mn.us/PDFs/c-book.pdf. |
|||||||||||||||||||||||||||||||||||||||||||||||||||||||||||||||||||||||||||||||||||||||||||||||||||||||||||||||
Learn more at http://www.dted.state.mn.us/big-pl-prog-rpt-f.asp or http://www.dted.state.mn.us |
top
|
||||||||||||||||||||||||||||||||||||||||||||||||||||||||||||||||||||||||||||||||||||||||||||||||||||||||||||||
|
|
|
||||||||||||||||||||||||||||||||||||||||||||||||||||||||||||||||||||||||||||||||||||||||||||||||||||||||||||||
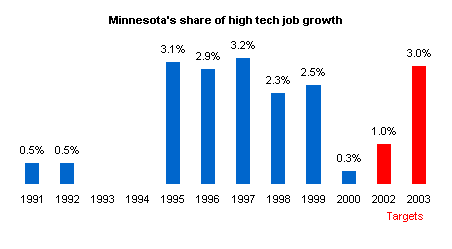
Source: Covered Employment and Wages Program (ES-202), U.S. Department of Labor, Bureau of Labor Statistics. Calculations by the Minnesota Department of Trade and Economic Development. Note: Minnesota's share of all high-tech jobs is important, but also our share of new high-tech jobs added each year in the country is an indicator of ongoing competitiveness. High-tech jobs are typically high-paying jobs that require educated, skilled workers. Increasing Minnesota's share of U.S. high-tech job growth increases Minnesota's share of national employment in these key industries. During the mid to late 1990s, Minnesota's share of U.S. high-tech job growth usually exceeded the state share of total national employment, indicating increasing importance of high-tech industries in Minnesota's economy relative to the nation. |
|||||||||||||||||||||||||||||||||||||||||||||||||||||||||||||||||||||||||||||||||||||||||||||||||||||||||||||||
Learn more at http://www.dted.state.mn.us/big-pl-prog-rpt-f.asp or http://www.dted.state.mn.us |
top
|
||||||||||||||||||||||||||||||||||||||||||||||||||||||||||||||||||||||||||||||||||||||||||||||||||||||||||||||
Minnesota's high-tech job growth (rate and actual number) compared with U.S. |
|||||||||||||||||||||||||||||||||||||||||||||||||||||||||||||||||||||||||||||||||||||||||||||||||||||||||||||||
|
|
|
||||||||||||||||||||||||||||||||||||||||||||||||||||||||||||||||||||||||||||||||||||||||||||||||||||||||||||||
|
Source: Covered Employment and Wages Program (ES-202), U.S. Department of Labor, Bureau of Labor Statistics. Calculations by the Minnesota Department of Trade and Economic Development. Note: This indicator shows the real growth (or loss) rate of high-tech jobs in Minnesota, compared with the overall U.S. rate. High-tech jobs are typically high-paying jobs that require educated, skilled workers. Increasing the number and rate of job growth in these key industries shows progress for Minnesota's economic health. Generally, rates and numbers of new jobs increased over the 1990s. There was a genuine boom in high-tech job growth in the mid- and late 1990's, following declines in the early 1990's. |
|||||||||||||||||||||||||||||||||||||||||||||||||||||||||||||||||||||||||||||||||||||||||||||||||||||||||||||||
Learn more at http://www.dted.state.mn.us/big-pl-prog-rpt-f.asp or http://www.dted.state.mn.us |
top
|
||||||||||||||||||||||||||||||||||||||||||||||||||||||||||||||||||||||||||||||||||||||||||||||||||||||||||||||
|
|
|||||||||||||||||||||||||||||||||||||||||||||||||||||||||||||||||||||||||||||||||||||||||||||||||||||||||||||||
|
|||||||||||||||||||||||||||||||||||||||||||||||||||||||||||||||||||||||||||||||||||||||||||||||||||||||||||||||
|
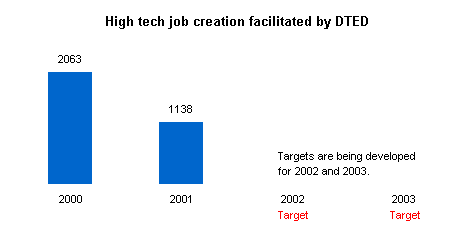
Source: Minnesota Department of Trade and Economic Development. Note: The Department of Trade and Economic Development works to ensure that businesses that are considering expanding in Minnesota are aware of resources that could assist in creating and retaining high-quality jobs. The department also works with these businesses to ensure that state and local resources and services are delivered. These activities are particularly important when the department assists expanding high-wage businesses in the growing high-tech sector. |
|||||||||||||||||||||||||||||||||||||||||||||||||||||||||||||||||||||||||||||||||||||||||||||||||||||||||||||||
|
top
|
||||||||||||||||||||||||||||||||||||||||||||||||||||||||||||||||||||||||||||||||||||||||||||||||||||||||||||||
|
|
|
||||||||||||||||||||||||||||||||||||||||||||||||||||||||||||||||||||||||||||||||||||||||||||||||||||||||||||||
|
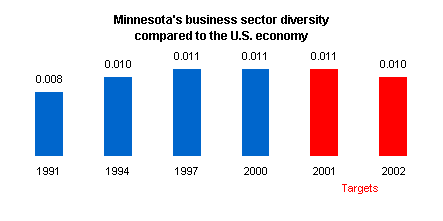
Source: Bureau of Economic Analysis, U.S. Department of Commerce. Calculations by the Minnesota Dept. of Trade and Economic Development. Note: This chart reflects how similar the state's economy is to the U.S. economy. The closer the statistic is to zero, the closer the distribution of state employment is to the distribution of national employment and thus the more diverse. The diversity statistic rose during the 1990s, indicating slightly less diversity. Increases in Minnesota's manufacturing sector employment, coupled with declines in U.S. manufacturing employment, likely contributed to this trend. Previous DTED work found that Minnesota had the fifth most diverse economy among the 50 states in 1997. Business and economic diversity is often cited as a means to surviving a downturn in a particular industry or to a problem that affects mainly companies of a certain size. Areas that are particularly dependent upon a few industries are supposedly more vulnerable in a downturn than areas that are dependent upon a broad set of industries. Therefore, an increase in industry diversity of Minnesota businesses is generally seen as desirable. |
|||||||||||||||||||||||||||||||||||||||||||||||||||||||||||||||||||||||||||||||||||||||||||||||||||||||||||||||
Learn more at http://www.dted.state.mn.us/big-pl-prog-rpt-f.asp or http://www.dted.state.mn.us |
top
|
||||||||||||||||||||||||||||||||||||||||||||||||||||||||||||||||||||||||||||||||||||||||||||||||||||||||||||||
|
|||||||||||||||||||||||||||||||||||||||||||||||||||||||||||||||||||||||||||||||||||||||||||||||||||||||||||||||
|
Source: Covered Employment and Wages Program (ES-202), U.S. Department of Labor, Bureau of Labor Statistics. Calculations by the Minnesota Department of Trade and Economic Development. Note: The diverse state economy is balanced among various industries. However, Minnesota has some industries that are under-represented. Under-represented industries are those industries that typically bring revenue to the state (i.e., serve non-local markets) and have a share of state employment less than 80 percent of the industry’s share of national employment. For Minnesota, these industries are: apparel and textile mill products, furniture and fixtures, chemicals, primary metal products, transportation equipment, communications and engineering/management services. In the late 1990s, the share of new jobs in the state in under-represented sectors was usually higher than the share of state employment in under-represented sectors, meaning that under-represented sectors are becoming a larger share of total unemployment. This increase adds to the desired balance of employment. |
|||||||||||||||||||||||||||||||||||||||||||||||||||||||||||||||||||||||||||||||||||||||||||||||||||||||||||||||
|
top
|
||||||||||||||||||||||||||||||||||||||||||||||||||||||||||||||||||||||||||||||||||||||||||||||||||||||||||||||
Business expansions in under-represented sectors facilitated by the Department |
|||||||||||||||||||||||||||||||||||||||||||||||||||||||||||||||||||||||||||||||||||||||||||||||||||||||||||||||
|
|||||||||||||||||||||||||||||||||||||||||||||||||||||||||||||||||||||||||||||||||||||||||||||||||||||||||||||||
|
Source: Minnesota Department of Trade and Economic Development Note: The Department of Trade and Economic Development is committed to expanding the state’s current industrial base while improving the diversity of the state’s economy. Facilitating high-quality job expansions in industries where the state is under-represented helps ensure that that the state can profit from growth throughout the economy while minimizing future economic indicators. |
|||||||||||||||||||||||||||||||||||||||||||||||||||||||||||||||||||||||||||||||||||||||||||||||||||||||||||||||
|
top
|
||||||||||||||||||||||||||||||||||||||||||||||||||||||||||||||||||||||||||||||||||||||||||||||||||||||||||||||
|
|
|
||||||||||||||||||||||||||||||||||||||||||||||||||||||||||||||||||||||||||||||||||||||||||||||||||||||||||||||
|
Source: Covered Employment and Wages Program (ES-202), U.S. Department of Labor, Bureau of Labor Statistics. Calculations by the Minnesota Department of Trade and Economic Development. Note: Job growth is a vital indicator of sustained opportunities in the labor market over the long term. Employment growth needs to keep pace with population growth in order to ensure adequate employment opportunities for all Minnesotans. Minnesota experienced rapid employment growth throughout the 1990s. Although there was one year with less than 7,000 new jobs (1991), the number of new jobs was typically between 40,000 and 70,000 per year. |
|||||||||||||||||||||||||||||||||||||||||||||||||||||||||||||||||||||||||||||||||||||||||||||||||||||||||||||||
Learn more at http://www.dted.state.mn.us/big-pl-prog-rpt-f.asp or http://www.dted.state.mn.us |
top
|
||||||||||||||||||||||||||||||||||||||||||||||||||||||||||||||||||||||||||||||||||||||||||||||||||||||||||||||
Percentage of national venture capital invested in Minnesota. |
|||||||||||||||||||||||||||||||||||||||||||||||||||||||||||||||||||||||||||||||||||||||||||||||||||||||||||||||
|
|
|
||||||||||||||||||||||||||||||||||||||||||||||||||||||||||||||||||||||||||||||||||||||||||||||||||||||||||||||
|
|
|
||||||||||||||||||||||||||||||||||||||||||||||||||||||||||||||||||||||||||||||||||||||||||||||||||||||||||||||
Source: National Venture Capital Association Yearbook. Note: Venture capital is provided in exchange for equity in a business and is typically used by relatively newer, smaller companies. Venture capitalists provide money to finance business operations and advice to the company. In 2000, over $103 billion of venture capital was invested in the U.S. through almost 7,000 deals. During the 1990s, venture capital disbursements to businesses in the state of Minnesota fluctuated widely, from less than 1 percent in 1993 and 1995 to over 3.3 percent in 1998. During 1999, venture capital levels exploded nationally due in part to dot.com business opportunities. For the indicator, Minnesota's total venture capital disbursements (payments) are divided by U.S. total venture capital disbursements
|
|||||||||||||||||||||||||||||||||||||||||||||||||||||||||||||||||||||||||||||||||||||||||||||||||||||||||||||||
Learn more at http://www.dted.state.mn.us/big-pl-prog-rpt-f.asp or http://www.dted.state.mn.us |
top
|
||||||||||||||||||||||||||||||||||||||||||||||||||||||||||||||||||||||||||||||||||||||||||||||||||||||||||||||
|
|
|
||||||||||||||||||||||||||||||||||||||||||||||||||||||||||||||||||||||||||||||||||||||||||||||||||||||||||||||
|
Source: Department of Trade and Economic Development, Analysis and Evaluation Office. Note: Business start-ups are generally recognized to be desirable for the entrepreneurial energy they create. This entrepreneurs are often key to an economy's innovation - key to economic success. |
|||||||||||||||||||||||||||||||||||||||||||||||||||||||||||||||||||||||||||||||||||||||||||||||||||||||||||||||
Learn more at http://www.dted.state.mn.us/big-pl-prog-rpt-f.asp or http://www.dted.state.mn.us |
top
|
||||||||||||||||||||||||||||||||||||||||||||||||||||||||||||||||||||||||||||||||||||||||||||||||||||||||||||||
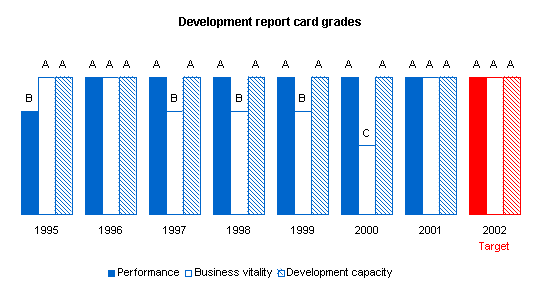
Grades on state's report card from the Corporation for Enterprise Development. |
|||||||||||||||||||||||||||||||||||||||||||||||||||||||||||||||||||||||||||||||||||||||||||||||||||||||||||||||
|
|
|||||||||||||||||||||||||||||||||||||||||||||||||||||||||||||||||||||||||||||||||||||||||||||||||||||||||||||||
Source: Corporation for Enterprise Development. Note: The Corporation for Enterprise Development produces the Development Report Card for the States, an annual assessment of each state's economy and potential for future growth based on more than 70 measures. These measures are combined into three overall grades. "Performance" measures how well states provide opportunities for employment, income and an improving quality of life. "Business vitality" assesses the health of the businesses in a state. "Development capacity" examines the quality and availability of the building blocks of successful economies, such as these education, roads, banking and technological resources. The Development Report Card provides objective comparison to other states. High grades and Honor Roll mention indicate the quality of the state's economic development activities and business climate. Minnesota earned Honor Roll mention from 1995 through 1999, and again in 2001. |
|||||||||||||||||||||||||||||||||||||||||||||||||||||||||||||||||||||||||||||||||||||||||||||||||||||||||||||||
Learn more at http://www.dted.state.mn.us/big-pl-prog-rpt-f.asp or http://www.dted.state.mn.us |
top
|
||||||||||||||||||||||||||||||||||||||||||||||||||||||||||||||||||||||||||||||||||||||||||||||||||||||||||||||
