What were things like in 2002?
The following idicator summary is from the 2002 Minnesota Milestones and does not neccessarily reflect the current data trends.Indicator : Energy use per person
Rationale: Energy use is a good measure of both economic and environmental health because virtually all economic activities require energy, and all forms of energy production and use have environmental impacts.
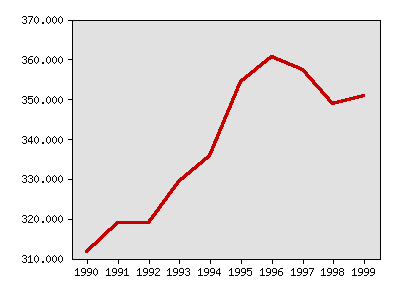
About this indicator: Despite a slight decline between 1996 and 1999, Minnesota's overall energy use per capita rose 13 percent between 1990 and 1999, from 312 million BTUs (British Thermal Units) to 351 million. This includes all traditional sources of energy and all uses – residential, commercial, industrial and transportation. The rate of population growth between 1990 and 1999 was nine percent while the energy consumption rate was 22 percent.
Increased energy use places a burden on the environment mainly because the vast majority of Minnesota's energy comes from finite fossil fuels, such as coal, petroleum and natural gas. These fuels are a key source of toxic air pollution and a major factor in global climate change, which could have significant effects on Minnesota's economy and environment. One limitation of the indicator is that “energy use per person” makes no distinctions among sources of energy or methods of producing it, when in fact energy produced from coal, natural gas and wind have very different economic and environmental effects.
Average annual energy use per person, in millions of BTUs

| Year | Data |
|---|---|
| Average annual energy use per person, in millions of BTUs, U.S. Energy Information Administration and U.S. Bureau of the Census | |
| 1990 | 311.6 |
| 1991 | 319.0 |
| 1992 | 318.8 |
| 1993 | 329.2 |
| 1994 | 335.8 |
| 1995 | 354.3 |
| 1996 | 360.6 |
| 1997 | 357.4 |
| 1998 | 348.8 |
| 1999 | 350.8 |
For comparison: Minnesota ranked 21st in the nation for total energy use in 1999. Minnesota's energy use per person is near the national average, but both Minnesota and the United States use relatively large amounts of energy per dollar of goods and services produced, compared to other industrialized countries.
Things to think about: A 1999 article in the Harvard Business Review, "A Road Map for Natural Capitalism" estimates that if the United States adopted the most efficient lighting, appliances and other electric devices available, the nation's $220 billion electric bill could be cut in half. Similarly, the Lawrence Berkley National Laboratory reports that currently available technologies could significantly reduce the world's annual growth rate in energy demand to 0.5 percent per year between 1990 and 2020
Technical notes: This indicator now relies on data from the federal Energy Information Administration to allow easier comparisons with other states and the nation as a whole. Figures reported in earlier editions of Minnesota Milestones have been revised to be consistent with Energy Information Administration data
Sources:Lawrence Berkley National Laboratory, Energy Efficiency Improvement Utilising High Technology: An Assessment of Energy Use in Industry and Buildings, 1995:
http://eetd.lbl.gov/
“A Road Map for Natural Capitalism,” by Amory Lovins, L. Hunter and Paul Hawken, Harvard Business Review (May-June 1999)
U.S. Department of Energy, Energy Information Administration, State Energy Data Report 1999; Minnesota Energy Use Rankings in 1999; and Energy Consumption Estimates by Source, 1960-1999, United States: www.eia.doe.gov
Related 2002 Milestones indicator:
Other related indicators:
- Energy use by fuel type (U.S. Department of Energy, www.eia.doe.gov)
- Estimated annual carbon dioxide emissions (Minnesota Pollution Control Agency, www.pca.state.mn.us. Local data for some cities.)
- Use of renewable energy, by source (U.S. Department of Energy, www.eia.doe.gov)
Local data:


