What were things like in 2002?
The following idicator summary is from the 2002 Minnesota Milestones and does not neccessarily reflect the current data trends.
Indicator : Renewable energy sources
Rationale: Trends in the use of energy from renewable sources give an indication of the state's future energy situation. The percentage of energy that Minnesota derives from local, clean and renewable sources directly affects the state's long-term economic and environmental stability and security because much of the state's fuel is currently imported.
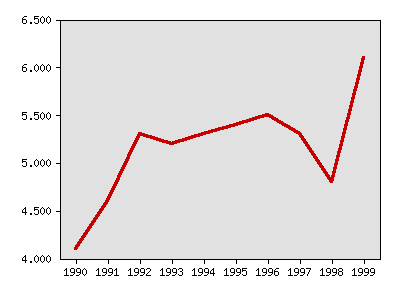
About this indicator: With slight fluctuations, the percentage of Minnesota's energy coming from local, renewable sources has risen from 4.1 percent in 1990 to 6.1 percent in 1999. Renewable energy includes hydroelectric, wind, solar, geothermal, wood and wood waste, other plant matter, municipal solid waste and landfill gases. Greater reliance on renewable sources of energy inside Minnesota could dramatically reduce air and water pollution, lower regulatory costs and lead to greater energy stability. Data for this indicator does not differentiate among energy sources.
Complete data on renewable energy supplied from outside the state is not available because the Minnesota Department of Commerce gets information only from companies within the state.
The total amount of renewable energy consumed in Minnesota has gone up 67 percent since 1990, but as a percent of total energy used remains below the 10 percent level that state officials thought might be achieved by 1998. This could be due to demand for energy outpacing the growth of renewable energy production.
Energy generated in Minnesota that is renewable, percent
Energy generated in Minnesota that is renewable, percent
| Year | Data |
|---|
| Energy generated in Minnesota that is renewable, percent, U.S. Energy Information Administration
|
|
1990 |
4.1% |
|
1991 |
4.6% |
|
1992 |
5.3% |
|
1993 |
5.2% |
|
1994 |
5.3% |
|
1995 |
5.4% |
|
1996 |
5.5% |
|
1997 |
5.3% |
|
1998 |
4.8% |
|
1999 |
6.1% |
For comparison: While Minnesota's use of renewable energy rose between 1990 and 1999, the United States' use of renewable energy slipped from 11.8 percent of total energy use to 10.8 percent in the same time period. Based on 1998 data, renewable energy use in other states varies widely, from 97 percent in Idaho and 63 percent in South Dakota to 5 percent in Wisconsin and 3 percent in Iowa.
Things to think about: Traditional, fossil-fuel-based energy production and use, including fuel burned in vehicles, is responsible for most of Minnesota's air pollution and emissions of greenhouse gases.
Giving consumers greater choice among electricity generation methods could boost solar, wind, and other renewable energy sources 40 percent by the end of the decade, according to a recent study by the National Renewable Energy Laboratory and the Lawrence Berkeley National Laboratory.
Wind power, in particular, has become the fastest growing energy sector in the world, and may become increasingly important in meeting Minnesota's future energy demands given the state's abundant wind resources. Stanford University researchers contend that wind power's cost of 3 to 4 cents per kilowatt hour is now competitive with coal, and possibly cheaper if environmental costs are factored in.
Technical notes: Figures may differ slightly from those presented in Minnesota Milestones 1998 because the data source for all years is the U.S. Energy Information Administration rather than the Minnesota Department of Commerce. One megawatt hour equals 1,000 kilowatt-hours. Renewable generation includes net utility and gross non-utility energy production while total generation includes all net data from all energy sources, both utility and non-utility.
Sources:
Minnesota Department of Commerce, Energy Division, www.commerce.state.mn.us/pages/EnergyMain.htm
Minnesota Pollution Control Agency, Air Quality in Minnesota: Problems and Approaches, January 2001, www.pca.state.mn.us/hot/legislature/reports/2001/aq-report-na.pdf
Stanford University, Stanford Report, Study advocates 'large-scale' U.S. wind power program, August 23, 2001, www.stanford.edu/dept/news/report/news/september5/windpower-95.html
U.S. Energy Information Administration, Annual Energy Review 2000, Electricity Overview, 1949-2000, www.eia.doe.gov
U.S. Energy Information Administration, Electric Power Industry Generation of Electricity by Primary Energy Source, 1988 through 1998, www.eia.doe.gov
U.S. Energy Information Administration, Renewable Energy Annual 2000, Appendix C, www.eia.doe.gov
National Renewable Energy Laboratory, Forecasting the Growth of Green Power Markets in the United States, October 2001 www.nrel.gov/
Related 2002 Milestones indicator:
Other related indicators:
- Energy use by fuel type (U.S. Energy Information Administration, www.eia.doe.gov)
- Use of renewable energy, by source (U.S. Energy Information Administration, www.eia.doe.gov)
Local data:


Milestones is a product of the Minnesota State Demographic Center, a division of the Department of Administration


