


What were things like in 2002?
The following idicator summary is from the 2002 Minnesota Milestones and does not neccessarily reflect the current data trends.Indicator : Counties losing population
Rationale: This indicator shows areas in Minnesota that are having trouble retaining and attracting residents.
About this indicator: The number of Minnesota counties losing population declined during most of the 1990s. Based on annual estimates, 25 to 35 Minnesota counties lost population in most years during the 1990s. According to the 2000 Census, 25 of 87 counties lost population during the decade as a whole. Strong economic growth during the 1990s minimized population losses for many Minnesota counties, and attracted new residents to others. Fewer counties lost population in the 1990s than in the 1980s.
Minnesota's population rose 12 percent between 1990 and 2000. Scott County had the highest population growth rate at 54 percent. Koochiching had the greatest decrease at 13 percent. Some of Koochiching's population loss can be attributed to the departure of construction workers temporarily residing in the county in 1990 that were counted in the 1990 census. The other 24 counties that lost population were all in the southern and western areas of the state. Many agricultural counties in other Great Plains states also lost population during the 1990s.
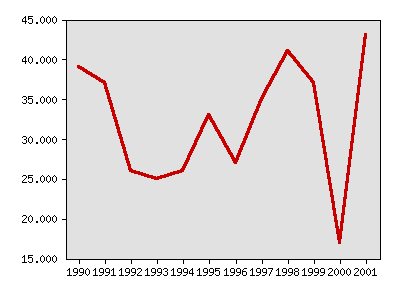
Number of counties with net population loss
| Year | Data |
|---|---|
| Number of counties with net population loss, U.S. Bureau of the Census | |
| 1990 | 39 |
| 1991 | 37 |
| 1992 | 26 |
| 1993 | 25 |
| 1994 | 26 |
| 1995 | 33 |
| 1996 | 27 |
| 1997 | 35 |
| 1998 | 41 |
| 1999 | 37 |
| 2000 | 17 |
| 2001 | 43 |
For comparison: Other than Wisconsin, Minnesota's neighboring states had numerous counties lose population during the 1990s. In North Dakota, 47 out of 53 counties lost population. Thirty-two of South Dakota's 66 counties lost population. Forty-five out of 99 counties lost population in Iowa. Only one county in Wisconsin out of 72 lost population during the 1990s.
Things to think about: Rapid population growth is not necessary for a community to be economically healthy, but population loss can create problems. Once population loss starts, it is often hard to reverse. It is difficult to attract and retain residents (other than retirees) without job growth, but with a shrinking labor force it is difficult to attract new jobs.
Technical notes: The large number of counties that went from population loss between 1998 and 1999, to population growth between 1999 and 2000, suggests that 1999 population estimates may have been too low. U.S. Census Bureau estimates of county population were used instead of population estimates from the Minnesota State Demographic Center, since Census Bureau estimates are used throughout Minnesota Milestones 2002.
Sources:U.S. Bureau of the Census, Decennial Census (1980, 1990, 2000) and U.S Bureau of the Census estimates for the other years, www.census.gov
Related 2002 Milestones indicator:
Other related indicators:
- Population estimates for cities and townships (State Demographic Center at Minnesota Planning, www.mnplan.state.mn.us)
Local data:


Milestones is a product of the Minnesota State Demographic Center, a division of the Department of Administration