


What were things like in 2002?
The following idicator summary is from the 2002 Minnesota Milestones and does not neccessarily reflect the current data trends.Indicator : Net gain in businesses
Rationale: The vitality of local economies depends on retaining and attracting businesses. This indicator measures the extent to which that has occurred in each Minnesota county.
About this indicator: This indicator was higher in the second half of the 1990s compared to the first half of the decade. In nine of the eleven years between 1990 and 2000, at least 63 Minnesota counties had net business gains. During a time of minimal economic growth, 1990, only 18 counties had net gains in businesses, the lowest amount in the decade. The strongest year was 1996, when 80 of Minnesota's 87 counties had net gains in the number of businesses. The strong growth in net businesses as well as business expansions in the latter half of the decade has resulted in historically low unemployment levels during the late 1990s for most parts of the state. These are all indications of strong local and regional economies.
Number of counties where business startups exceed business closures
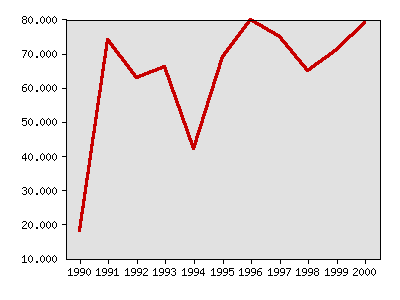
| Year | Data |
|---|---|
| Number of counties where business startups exceed business closures, Minnesota Department of Trade and Economic Development | |
| 1990 | 18 |
| 1991 | 74 |
| 1992 | 63 |
| 1993 | 66 |
| 1994 | 42 |
| 1995 | 69 |
| 1996 | 80 |
| 1997 | 75 |
| 1998 | 65 |
| 1999 | 71 |
| 2000 | 79 |
Things to think about: At least 65 Minnesota counties have had net business gains every year since 1995. In 2000, Minnesota had a net gain of 3,933 businesses. A net increase in businesses does not necessarily mean an increase in jobs. A community could have more businesses from one year to the next, but job gains from new businesses may not offset job losses in existing businesses. Most new businesses, which are small, tend to have high failure rates.
Technical notes: Businesses that were sold or merged may be mistakenly counted as start-ups or closures. In order to avoid disclosure of some individual businesses, data was suppressed for some counties in some years. Any business with at least one wage-earning employee is counted in this data. However, self-employed people, farmers, religious workers and elected officials are not counted. The Minnesota Department of Trade and Economic Development's Business Tracking System data is based on information provided by the Research Division and Tax Division of the Minnesota Department of Economic Security, including quarterly reports to the Reemployment Insurance program.
Sources:Minnesota Department of Trade and Economic Development, Office of Analysis and Evaluation, Business Tracking System: Minnesota Business Births, Dissolutions, Expansions and Contractions, www.dted.state.mn.us/05x00f.asp
Related 2002 Milestones indicator:
Other related indicators:
- Employment growth rate (Minnesota Department of Economic Security, www.mnwfc.org)
Local data:


Milestones is a product of the Minnesota State Demographic Center, a division of the Department of Administration