State Budget Details
During this legislative session, the state will set its budget for the next two fiscal years: July 1, 2009 through June 30, 2011. The senate put together this primer to help you understand how the state prepares its budget. Below you will find information that explains where the money comes from and where it is spent.
All of these projections are based on the 2008 November Economic Forecast prepared by the Department of Management and Budget. Minnesota state government sets a two year budget, and so all budget documents reflect this two year time span. These charts project what state government will collect and spend if no laws are changed this year. The Legislature uses this information to make budget decisions. None of the information below sets the state’s budget in stone.
The Minnesota Constitution, state statutes and the Commissioner of Finance create funds to support public services. A fund usually has language in law establishing it and identifying what money should be deposited into it and for what purposes money may be expended from the fund. State statute requires that no fund may carry a negative balance at the end of a state fiscal biennium.
The biggest fund is the general fund. The general fund is where most of the taxes that the state collects are deposited (e.g., the income and sales taxes) It is also the fund used to pay for high profile items like education, health care and prisons. Given its importance, the Legislature devotes considerable attention to developing a budget for the general fund. The general fund is constitutionally required to be balanced by the end of each biennium. Discussion of a budget deficit this year refers to a deficit within the general fund.
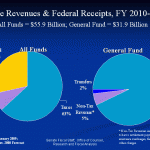
The chart below shows how much money is projected to come into the state’s treasury during fiscal years 2010 and 2011, and from which revenue sources that money is collected. State revenue is then allocated into the appropriate fund, with most state revenue being deposited into the general fund.
As seen in the pie chart above on the left labeled “All Funds,” federal funds comprise a large proportion of the state’s budget. These federal funds tend to be dedicated to specific programs that the state administers, programs like Medical Assistance that pays for seniors in nursing homes. The chart on the right labeled “General Fund” shows you what kind of revenue sources feed into the state’s general fund.
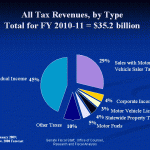
The chart below shows what kind of taxes the state collects and how much is expected to be collected in the next two years. Some of these taxes are constitutionally dedicated to a specific purpose, like the gasoline tax.
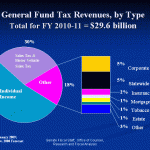
The chart below show what kind of taxes flow into the state’s general fund. As you can see, most of the general fund derives from the individual income tax, with the second largest revenue source being the sales tax. In 2006, Minnesota voters passed a constitutional amendment that will eventually dedicate the motor vehicle sales tax (MVST) to transit. This is the last fiscal year biennia where a portion of the MVST will go into the general fund.
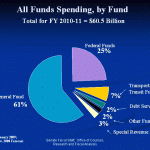
The chart below shows the major state funds and their proportion of overall state spending. As you can see, the general fund is the largest fund in Minnesota state government.
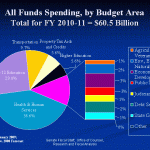
The chart below shows a basic breakdown of state spending for each budget area. This information includes both state revenues and federal funds.
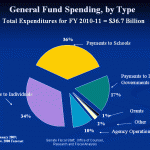
The chart below shows the general categories of spending from the general fund.
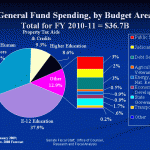
Finally, the chart below shows the general fund spending breakdown among budget areas.
If you are interested in learning more about the process the state uses to prepare the budget, see this primer from the Senate Fiscal Analysis Office, “Minnesota Budget Process Requirements.”

