


Indicator 14: Life Expectancy


Goal: Minnesotans will be healthy.
Rationale: Life expectancy is used worldwide as a broad snapshot of human health.
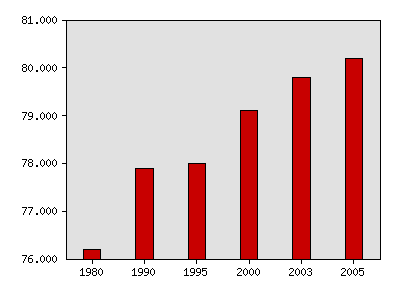
About this indicator: Life expectancy for the total Minnesota population increased steadily from 77.9 years in 1990 to 80.2 in 2005.
Women live longer than men, but the gap between the sexes has narrowed considerably as men have posted greater gains.
Expected years of life remaining at birth
| Year | Data |
|---|---|
| Expected years of life remaining at birth, National Center for Health Statistics and Minnesota State Demographic Center | |
| 1980 | 76.2 |
| 1990 | 77.9 |
| 1995 | 78.0 |
| 2000 | 79.1 |
| 2003 | 79.8 |
| 2005 | 80.2 |
For comparison: The national life expectancy in 2005 was 77.5 years.
Technical notes: Life expectancy is based on a mathematical model using population by age and mortality by age. Life expectancy in any given year is the average number of years that will be lived by a child born in that year if mortality rates by age remain constant.
Sources:
- Minnesota State Demographic Center, http://www.demography.state.mn.us/
- U.S. Centers for Disease Control and Prevention, National Center for Health Statistics, National Vital Statistics Report, http://www.cdc.gov/nchs
Related 2002 Milestones indicator:
Local data:


Milestones is a product of the Minnesota State Demographic Center, a division of the Department of Administration