


What were things like in 2002?
The following idicator summary is from the 2002 Minnesota Milestones and does not neccessarily reflect the current data trends.Custom Report:
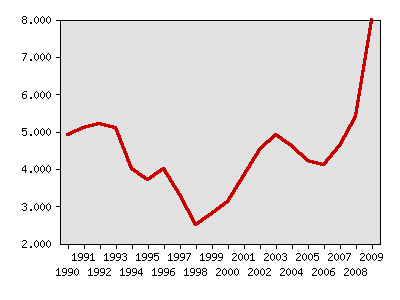
Minnesota unemployment rate
| Year | Data |
|---|---|
| Minnesota unemployment rate, Minnesota Department of Employment and Economic Development | |
| 1990 | 4.9% |
| 1991 | 5.1% |
| 1992 | 5.2% |
| 1993 | 5.1% |
| 1994 | 4% |
| 1995 | 3.7% |
| 1996 | 4% |
| 1997 | 3.3% |
| 1998 | 2.5% |
| 1999 | 2.8% |
| 2000 | 3.1% |
| 2001 | 3.8% |
| 2002 | 4.5% |
| 2003 | 4.9% |
| 2004 | 4.6% |
| 2005 | 4.2% |
| 2006 | 4.1% |
| 2007 | 4.6% |
| 2008 | 5.4% |
| 2009 | 8% |


Milestones is a product of the Minnesota State Demographic Center, a division of the Department of Administration