


What were things like in 2002?
The following idicator summary is from the 2002 Minnesota Milestones and does not neccessarily reflect the current data trends.Custom Report:
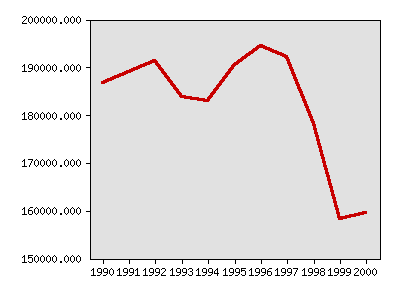
Serious property crimes reported
| Year | Data |
|---|---|
| Serious property crimes reported, Minnesota Department of Public Safety | |
| 1990 | 186,628 |
| 1991 | 188,998 |
| 1992 | 191,319 |
| 1993 | 183,825 |
| 1994 | 182,942 |
| 1995 | 190,560 |
| 1996 | 194,407 |
| 1997 | 192,153 |
| 1998 | 178,069 |
| 1999 | 158,256 |
| 2000 | 159,566 |


Milestones is a product of the Minnesota State Demographic Center, a division of the Department of Administration