


What were things like in 2002?
The following idicator summary is from the 2002 Minnesota Milestones and does not neccessarily reflect the current data trends.Custom Report:
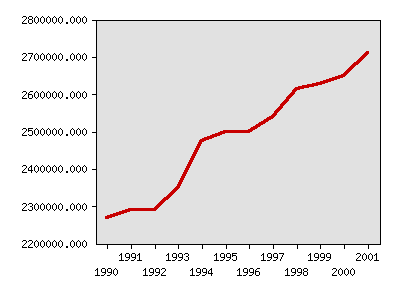
Employed Minnesotans age 16 and over
| Year | Data |
|---|---|
| Employed Minnesotans age 16 and over, Minnesota Department of Economic Security and U.S. Bureau of the Census | |
| 1990 | 2,268,780 |
| 1991 | 2,289,419 |
| 1992 | 2,289,419 |
| 1993 | 2,349,196 |
| 1994 | 2,473,515 |
| 1995 | 2,498,821 |
| 1996 | 2,499,522 |
| 1997 | 2,537,651 |
| 1998 | 2,613,454 |
| 1999 | 2,627,437 |
| 2000 | 2,649,145 |
| 2001 | 2,710,298 |


Milestones is a product of the Minnesota State Demographic Center, a division of the Department of Administration