


Indicator 20: Traffic Injuries and Fatalities

Goal: Minnesotans will be healthy.
Rationale: Traffic accidents kill many people and injuries can result in pain, disability and high medical costs.
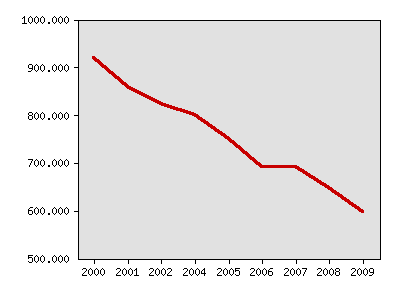
About this indicator: The rate of traffic injuries and fatalities per 100,000 population has fallen substantially from 919.5 in 2000 to 648.1 in 2008. Possible factors include more seatbelt use, safer cars, improved road design and stricter impaired driving laws.
Minnesota traffic fatalities and injuries per 100,000 population
| Year | Data |
|---|---|
| Minnesota traffic fatalities and injuries per 100,000 population, Minnesota Office of Traffic Safety | |
| 2000 | 919.5 |
| 2001 | 858.9 |
| 2002 | 823.9 |
| 2004 | 800.3 |
| 2005 | 749.2 |
| 2006 | 690.6 |
| 2007 | 691.3 |
| 2008 | 648.1 |
| 2009 | 598.1 |
For comparison: There were 455 traffic fatalities in 2008, the lowest number since 1945. Improved trauma treatment may have played a role in reducing fatalities.
Sources:
- Minnesota Office of Traffic Safety, http://www.dps.state.mn.us/OTS/crashdata/crash_facts.asp
- Minnesota Department of Transportation, http://www.dot.state.mn.us/measures/pdf/Annual%20Measures%20Report%205-18%20(small).pdf
Local data:


Milestones is a product of the Minnesota State Demographic Center, a division of the Department of Administration