


What were things like in 2002?
The following idicator summary is from the 2002 Minnesota Milestones and does not neccessarily reflect the current data trends.Indicator : Satisfaction with government services
Rationale: This indicator measures progress toward this goal by tracking citizens' satisfaction with government services.
About this indicator: Satisfaction with state and local government services has increased over the last six years. Since the survey question was first asked in 1995, a majority of Minnesota adults have been either very satisfied or somewhat satisfied with the government services. In 2001, 87 percent said they were satisfied. The survey does not ask about specific services or distinguish between state and local governments.
Percentage of Minnesotans satisfied with the amount and quality of services they get from state and local government
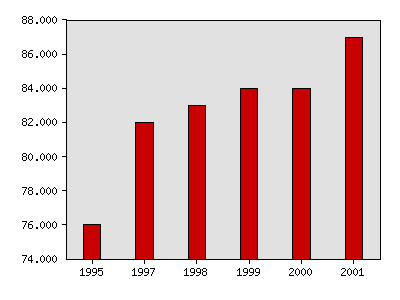
| Year | Data |
|---|---|
| Percentage of Minnesotans satisfied with the amount and quality of services they get from state and local government, University of Minnesota, Minnesota Center for Survey Research | |
| 1995 | 76% |
| 1997 | 82% |
| 1998 | 83% |
| 1999 | 84% |
| 2000 | 84% |
| 2001 | 87% |
Things to think about: It is just as important to measure the effectiveness of specific government programs and services as to ask about satisfaction with government in its entirety. In 2001, the Governor asked state agencies to develop key indicators to measure progress toward agency goals. To view state agency results see www.mnplan.state.mn.us/indicators/departments
Technical notes: In a statewide telephone survey, respondents were asked: "How satisfied are you with the amount and quality of services you get from state and local government: very satisfied, somewhat satisfied, somewhat dissatisfied, or very dissatisfied?" The survey has a 3.5 percent confidence interval there is a 95 percent probability that, if all Minnesota households were surveyed, the results would not differ from this sample survey by more than 3.5 percentage points.
Sources:University of Minnesota, Minnesota Center for Survey Research, Minnesota State Survey, www.cura.umn.edu/programs/mcsr.html
Related 2002 Milestones indicator:
Other related indicators:
- State bond ratings (bond rating firms such as Moody's, Standard and Poor's, and Fitch's.)
Local data:


Milestones is a product of the Minnesota State Demographic Center, a division of the Department of Administration