


Indicator 30: Price of Government


Goal: Government in Minnesota will be cost-efficient, and services will be designed to meet the needs of the people who use them.
Rationale: Minnesotans expect their state and local governments to spend money carefully and effectively. This indicator indirectly measures progress toward this goal by tracking how much government spends compared to how much people earn.
About this indicator: The proportion of personal income going to state and local revenues has fluctuated within a narrow range and shows no real trend since 2000. The annual figure ranges between 15.0 and 16.2 percent of income.
This indicator reports the price of government based on actual revenues collected. During good economic times, revenues sometimes exceed expectations and push the actual price of government above the target set by the Governor and Legislature.
This indicator reports the price of government based on actual revenues collected. During good economic times, revenues sometimes exceed expectations and push the actual price of government above the target set by the Governor and Legislature.
State and local government taxes and fees, as a percentage of personal income
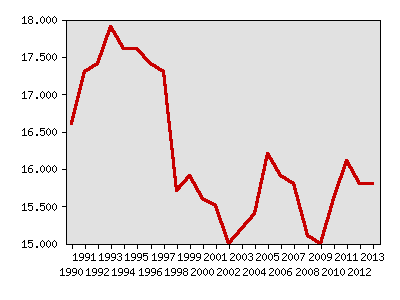
| Year | Data |
|---|---|
| State and local government taxes and fees, as a percentage of personal income, Minnesota Department of Finance | |
| 1990 | 16.6% |
| 1991 | 17.3% |
| 1992 | 17.4% |
| 1993 | 17.9% |
| 1994 | 17.6% |
| 1995 | 17.6% |
| 1996 | 17.4% |
| 1997 | 17.3% |
| 1998 | 15.7% |
| 1999 | 15.9% |
| 2000 | 15.6% |
| 2001 | 15.5% |
| 2002 | 15% |
| 2003 | 15.2% |
| 2004 | 15.4% |
| 2005 | 16.2% |
| 2006 | 15.9% |
| 2007 | 15.8% |
| 2008 | 15.1% |
| 2009 | 15% |
| 2010 | 15.6% |
| 2011 | 16.1% |
| 2012 | 15.8% |
| 2013 | 15.8% |
For comparison: The price of government has declined since the mid-1990s, when it was in excess of 17.0 percent.
Comparisons with other states are not possible. This measure is unique to Minnesota.
Technical notes: Most local governments begin their fiscal year in January, while state government and school districts have fiscal years that begin in July. The price of government is computed for the fiscal years ending between July 1 and June 30. For example, the 2007 price of government is based on local government revenue for the fiscal year ending December 2006 and school district and state revenue for the fiscal year ending June 2007.
Sources:
- Minnesota Management and Budget, Financial Forecasts and Updates, http://www.finance.state.mn.us/
Related 2002 Milestones indicator:
Local data:


Milestones is a product of the Minnesota State Demographic Center, a division of the Department of Administration