


What were things like in 2002?
The following idicator summary is from the 2002 Minnesota Milestones and does not neccessarily reflect the current data trends.Custom Report:
Population, 15 to 17 year old girls
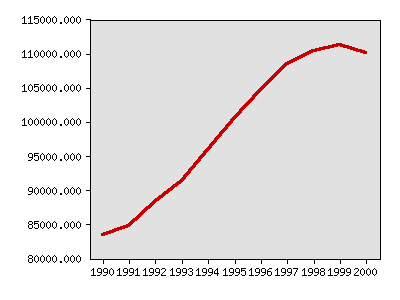
| Year | Data |
|---|---|
| Population, 15 to 17 year old girls, U.S. Bureau of the Census | |
| 1990 | 83,422 |
| 1991 | 84,718 |
| 1992 | 88,244 |
| 1993 | 91,332 |
| 1994 | 95,869 |
| 1995 | 100,612 |
| 1996 | 104,680 |
| 1997 | 108,509 |
| 1998 | 110,343 |
| 1999 | 111,243 |
| 2000 | 110,039 |


Milestones is a product of the Minnesota State Demographic Center, a division of the Department of Administration