


What were things like in 2002?
The following idicator summary is from the 2002 Minnesota Milestones and does not neccessarily reflect the current data trends.Custom Report:
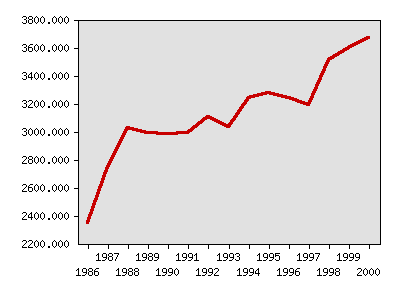
Gallons of water used per day, in millions
| Year | Data |
|---|---|
| Gallons of water used per day, in millions, Minnesota Department of Natural Resources | |
| 1986 | 2,348 |
| 1987 | 2,748 |
| 1988 | 3,027 |
| 1989 | 2,992 |
| 1990 | 2,981 |
| 1991 | 2,989 |
| 1992 | 3,104 |
| 1993 | 3,030 |
| 1994 | 3,241 |
| 1995 | 3,277 |
| 1996 | 3,238 |
| 1997 | 3,186 |
| 1998 | 3,510 |
| 1999 | 3,597 |
| 2000 | 3,669 |
Local data:


Milestones is a product of the Minnesota State Demographic Center, a division of the Department of Administration