


What were things like in 2002?
The following idicator summary is from the 2002 Minnesota Milestones and does not neccessarily reflect the current data trends.Custom Report:
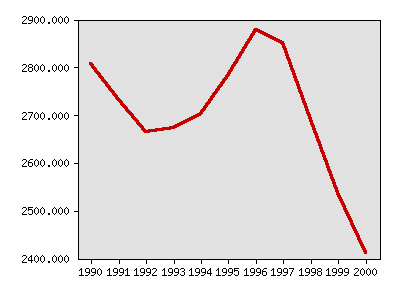
Pregnant teens, 15 to 17 year old girls, total
| Year | Data |
|---|---|
| Pregnant teens, 15 to 17 year old girls, total, Minnesota Department of Health | |
| 1990 | 2,807 |
| 1991 | 2,732 |
| 1992 | 2,665 |
| 1993 | 2,674 |
| 1994 | 2,702 |
| 1995 | 2,782 |
| 1996 | 2,879 |
| 1997 | 2,850 |
| 1998 | 2,690 |
| 1999 | 2,538 |
| 2000 | 2,411 |


Milestones is a product of the Minnesota State Demographic Center, a division of the Department of Administration