


What were things like in 2002?
The following idicator summary is from the 2002 Minnesota Milestones and does not neccessarily reflect the current data trends.Custom Report:
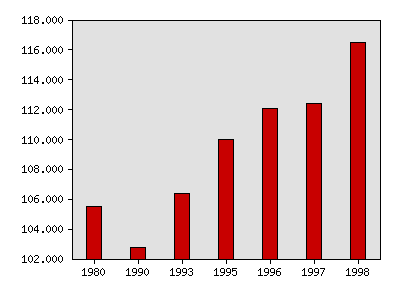
Median household income as a percentage of the U.S. median
| Year | Data |
|---|---|
| Median household income as a percentage of the U.S. median, U.S. Bureau of the Census | |
| 1980 | 105.5% |
| 1990 | 102.8% |
| 1993 | 106.4% |
| 1995 | 110.0% |
| 1996 | 112.1% |
| 1997 | 112.4% |
| 1998 | 116.5% |


Milestones is a product of the Minnesota State Demographic Center, a division of the Department of Administration