This Web-based document was archived by the Minnesota Legislative Reference Library.
Minnesota Milestones 2010: Average Wage
 
 
How is Minnesota doing?
Keep an eye out for these images to quickly tell which way the trend is going:
Thumbs down
Undesirable or negative
Thumbs maybe
No change, or not enough data to draw conclusions
Thumbs up
Desirable or positive.
login

Indicator 44: Average Wage

Thumbs downimage
Goal: All Minnesotans will have the economic means to maintain a reasonable standard of living.
Rationale: Hourly or weekly wages are the major determinant of income and spending power for the working-age population.
About this indicator: Wages have grown slowly in the 2000s. The average weekly wage for workers in all industries was $874 in 2009, compared to $851 in 2000. These figures are adjusted for inflation. Between 2008 and 2009, Minnesota average wage decline by 0.8%, the second decline in two years
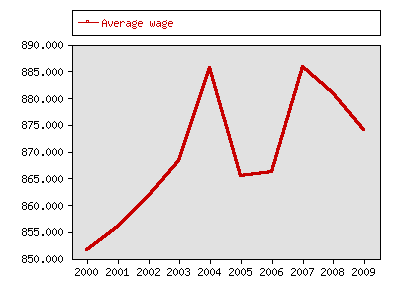
graph
Average weekly wage in 2008 dollars, % change from previous year
YearData
Average weekly wage in 2008 dollars, Minnesota Department of Employment and Economic Development Edit trend | Edit data
Average weekly wage in 2008 dollars, % change from previous year, Minnesota Department of Employment and Economic Development Edit trend | Edit data
Average wage % change
2000851.5 N
2001855.9 0.5%
2002861.7 0.7%
2003868.2 0.8%
2004885.6 2.0%
2005865.4 -2.3%
2006866.1 0.1%
2007885.8 2.3%
2008881.0 -0.5%
2009874.0 -0.8%
         Select data sets for individual graphing:
Create merged graph of all datasets
Create merged graph of selected datasets

N: No data
For comparison: Between 2001 and 2008, average wages in Minnesota and the U.S. grew at an almost identical rate. The 2009 average wage in the U.S., $879, was close to the Minnesota average, $874.
Technical notes: Data come from the QCEW system and are based on establishments qualifying for unemployment insurance coverage.
Sources:
Local data:

Milestones is a product of the Minnesota State Demographic Center, a division of the Department of Administration