


What were things like in 2002?
The following idicator summary is from the 2002 Minnesota Milestones and does not neccessarily reflect the current data trends.Custom Report:
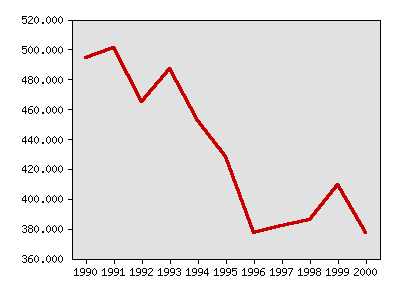
Infant deaths, total
| Year | Data |
|---|---|
| Infant deaths, total, Minnesota Department of Health | |
| 1990 | 494 |
| 1991 | 501 |
| 1992 | 465 |
| 1993 | 487 |
| 1994 | 452 |
| 1995 | 428 |
| 1996 | 377 |
| 1997 | 382 |
| 1998 | 386 |
| 1999 | 409 |
| 2000 | 377 |
Local data:


Milestones is a product of the Minnesota State Demographic Center, a division of the Department of Administration