


What were things like in 2002?
The following idicator summary is from the 2002 Minnesota Milestones and does not neccessarily reflect the current data trends.Custom Report:
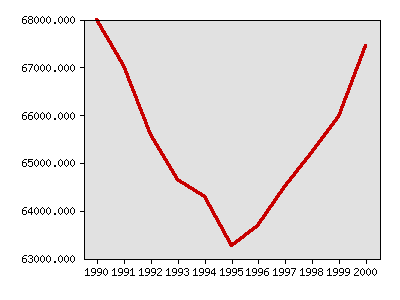
Total births to Minnesota residents
| Year | Data |
|---|---|
| Total births to Minnesota residents, Minnesota Department of Health | |
| 1990 | 67,986 |
| 1991 | 67,037 |
| 1992 | 65,591 |
| 1993 | 64,646 |
| 1994 | 64,277 |
| 1995 | 63,259 |
| 1996 | 63,682 |
| 1997 | 64,491 |
| 1998 | 65,207 |
| 1999 | 65,953 |
| 2000 | 67,452 |


Milestones is a product of the Minnesota State Demographic Center, a division of the Department of Administration