


Indicator 25: Food Shelf Use

Goal: All people will be welcomed, respected and able to participate fully in Minnesota's communities and economy.
Rationale: Food shelf use gives some indication of the number of Minnesotans requiring assistance with this basic need, and the availability of food assistance to help them.
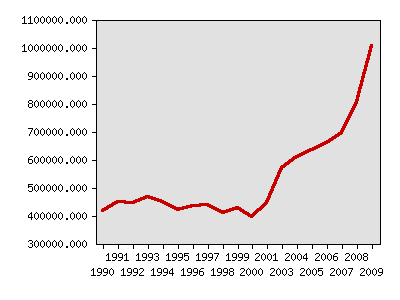
About this indicator: The number of household visits to food shelves has grown each year since 2003. Between 2008 and 2009, the number of visits increased 25 percent.
Household visits to food shelves
| Year | Data |
|---|---|
| Household visits to food shelves, Hunger Solutions Minnesota | |
| 1990 | 416,552 |
| 1991 | 449,232 |
| 1992 | 446,175 |
| 1993 | 465,977 |
| 1994 | 447,213 |
| 1995 | 421,369 |
| 1996 | 433,214 |
| 1997 | 435,881 |
| 1998 | 408,335 |
| 1999 | 425,583 |
| 2000 | 396,002 |
| 2001 | 443,939 |
| 2003 | 571,031 |
| 2004 | 609,730 |
| 2005 | 634,116 |
| 2006 | 660,476 |
| 2007 | 695,004 |
| 2008 | 805,207 |
| 2009 | 1,006,714 |
For comparison: No national figures are available on food shelf use. The USDA reports data on household food insecurity based on responses to the annual food security module in the Current Population Survey. Survey questions cover anxiety that the household budget is inadequate to buy enough food, concern over inadequate quantity or quality of food, and instances of reduced food intake. For the 2007-2009 period, Minnesotas rate of food security was 10.5 percent, lower than 43 other states.
Sources:
- Hunger Solutions http://www.hungersolutions.org/
Related 2002 Milestones indicator:
Local data:


Milestones is a product of the Minnesota State Demographic Center, a division of the Department of Administration