


Indicator 49: Regional Disparity in Unemployment


Goal: Rural areas, small cities and urban neighborhoods throughout the state will be economically viable places for people to live and work.
Rationale: Differences in unemployment rates are a key indicator of variations in economic opportunity.
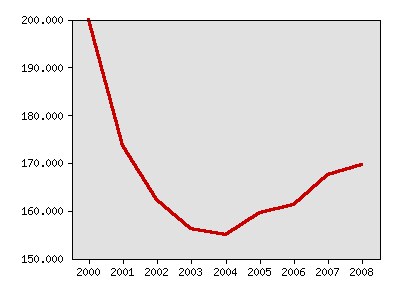
About this indicator: The ratio of the highest regional unemployment rate to the lowest rate declined from 2.00 in 2000 to 1.55 in 2004, then rose again. In 2008 the ratio of the highest to the lowest was 1.70.
The regions used are Economic Development Regions. There are 13 regions.
Highest regional unemployment rate as a percentage of lowest regional unemployment rate
| Year | Data |
|---|---|
| Highest regional unemployment rate as a percentage of lowest regional unemployment rate, Minnesota Department of Employment and Economic Development | |
| 2000 | 200% |
| 2001 | 173.5% |
| 2002 | 162.2% |
| 2003 | 156.1% |
| 2004 | 155% |
| 2005 | 159.5% |
| 2006 | 161.1% |
| 2007 | 167.5% |
| 2008 | 169.6% |
For comparison: In October, 2009 Region 1 (Northwest) and Region 8 (Southwest) had the lowest unemployment rates, 4.9 percent. The highest unemployment rate was 9.0 percent in Region 7E, the East Central Region. The state unemployment rate in October was 6.9 percent, with a seasonally adjusted rate of 7.6 percent.
Technical notes: This indicator uses annual average unemployment rates.
Sources:
- Minnesota Department of Employment and Economic Development, http://www.deed.state.mn.us/lmi/tools/laus/Default.aspx
Related 2002 Milestones indicator:
Local data:


Milestones is a product of the Minnesota State Demographic Center, a division of the Department of Administration