


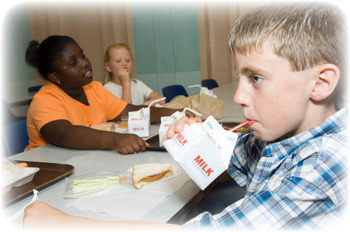
Indicator 2: Low-income School Children

Rationale: Eligibility for free or reduced-price school meals is an important measure of child poverty trends, because it is updated every year. Poverty can do both immediate and lasting harm to children. Children who grow up in poverty are more likely to lack adequate food and clothing, live in poor housing, become victims of crime and violence, lack basic health care and be less successful in school.
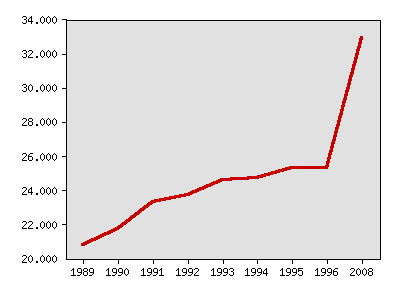
About this indicator: The proportion of public school children from low-income families has risen steadily. In the 2008-2009 school year, 32.9 percent of K-12 students in Minnesota qualified for a free or reduced-price meal. The rate has increased substantially since 1989-1990, when it was 20.8 percent. The rate stabilized in the late 1990s, but has shown a marked gain in the 2000s.
Students are eligible for free lunch when family income is below 130 percent of the federal poverty level. They qualify for reduced-price lunch and breakfast when family income is between 130 percent and 185 percent of the poverty level. In 2008-09, 24.9 percent of children qualified for free lunch and 8.0 percent qualified for reduced-price meals.
Percentage of public school children approved for free or reduced-price school meals
| Year | Data |
|---|---|
| Percentage of public school children approved for free or reduced-price school meals, Minnesota Department of Education | |
| 1989 | 20.8% |
| 1990 | 21.7% |
| 1991 | 23.3% |
| 1992 | 23.7% |
| 1993 | 24.6% |
| 1994 | 24.7% |
| 1995 | 25.3% |
| 1996 | 25.3% |
| 2008 | 32.9% |
For comparison: Federal data is collected differently, making comparison among states impossible.
Within Minnesota, there is great variation from region to region and among school districts. In Mahnomen County, 67 percent of K-12 students qualify for free or reduced-price meals. In Carver County, only 14 percent qualify.
Things to think about: Some of the growth in the late 1980s and early 1990s can be attributed to increased efforts to enroll eligible children in the program.
Technical notes: The percentages shown are for all school children in kindergarten through twelfth grade enrolled on October 1 of each school year, who are eligible and sign up for the program. Poverty levels are adjusted each year and vary with the size of the family.
Sources:
- Minnesota Department of Education http://education.state.mn.us/MDE/Data/Data_Downloads/Student/Enrollment/State/index.html
Related 2002 Milestones indicator:
Local data:


Milestones is a product of the Minnesota State Demographic Center, a division of the Department of Administration