


Indicator 46: Housing Costs


Goal: All Minnesotans will have decent, safe and affordable housing.
Rationale: This indicator defines housing affordability in relation to household income.
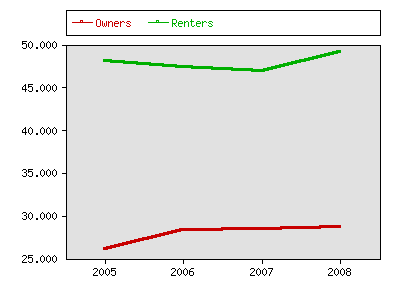
About this indicator: Housing costs are rising. The percentage of households spending at least 30 percent of their income on housing grew from 31.1 to 33.7 percent between 2005 and 2008. Among renters, 49.1 percent spent at least 30 percent of their income on housing. Among homeowners, the figure was 28.7 percent.
For comparison: Among owner-occupied households with a mortgage, Minnesota ranked 24th on the percent spending 30 percent of more of their income on housing costs. The Minnesota figure was 34.4 percent, below the U.S. average of 37.6 percent.
Housing costs are considerably higher than in the 2000 Census, when 37 percent of renters and 22 percent of owners lived in unaffordable housing.
Technical notes: Spending more than 30 percent of income on housing is a widely accepted indicator of expenditure levels that most households cannot afford.
Sources:
- www.census.gov http://factfinder.census.gov/home/saff/main.html?_lang=en
Related 2002 Milestones indicator:
Local data:


Milestones is a product of the Minnesota State Demographic Center, a division of the Department of Administration