


Indicator 33: Growth in Gross State Product


Goal: Minnesota will have sustainable, strong economic growth.
Rationale: Economic growth creates jobs and may increase opportunities for better jobs and improved living standards. Sustainable, strong economic growth puts Minnesota in a better position to achieve other Minnesota Milestones goals.
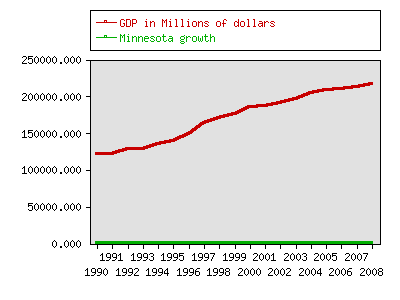
Gross state product is the most commonly used measure of overall economic production. Continuous growth in gross state product is a strong indication of a healthy economy.
About this indicator: Minnesota's annual real growth in gross state product has been tepid in the past four years, with growth less than 2 percent in each year. Growth was stronger in the late 1990s, when annual growth rates ranged between 3 and 5 percent.
Gross state product is the value of all goods and services produced in the state.
For comparison: Among 50 states and the District of Columbia, Minnesota ranked 27th in per capita gross state product growth between 2000 and 2008. Minnesotas gain of 10.8 percent was slightly above the national average of 9.6 percent. The national average was pulled down by subpar performance in some large industrial states. The per capita comparison controls for differences in population growth among states.
Technical notes: The indicator used is millions of 2000 chained dollars. Because of changes in the industrial classification system, totals for 1996 and 1997 are not exactly comparable.
Sources:
- U.S. Department of Commerce, Bureau of Economic Analysis, regional accounts data, http://www.bea.doc.gov/bea/regional/data.htm
Related 2002 Milestones indicator:
Local data:


Milestones is a product of the Minnesota State Demographic Center, a division of the Department of Administration