


Indicator 44: Average Wage


Goal: All Minnesotans will have the economic means to maintain a reasonable standard of living.
Rationale: Hourly or weekly wages are the major determinant of income and spending power for the working-age population.
About this indicator: Wages have grown slowly in the 2000s. The average weekly wage for workers in all industries was $881 in 2008, compared to $851 in 2000. These figures are adjusted for inflation.
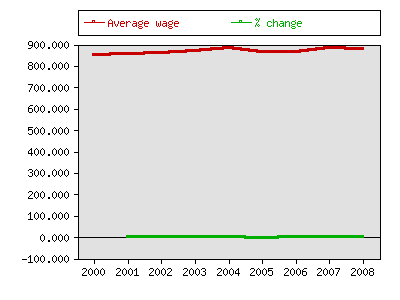
For comparison: Between 2001 and 2008, average wages in Minnesota and the U.S. grew at an almost identical rate. The 2008 average wage in the U.S., $876, was very close to the Minnesota average, $881.
Technical notes: Data come from the QCEW system and are based on establishments qualifying for unemployment insurance coverage.
Sources:
- Minnesota Department of Employment and Economic Development, http://www.deed.state.mn.us/lmi/tools/qcew/default.aspx
Local data:


Milestones is a product of the Minnesota State Demographic Center, a division of the Department of Administration